

As the bitcoin price rally gets into high gear, technical indicators at the long, mid and short term levels suggest that there could be corrections on the horizon, after a continued rise to $820 USD.
Also read: Bitcoin Price Bursts Ahead, Nearing $700 USD
Let’s take a look at the indicators in the first installment of Bitcoinist.net’s new technical analysis series by Ramiro Burgos
Bitcoin Price Analysis
Long Term Analysis
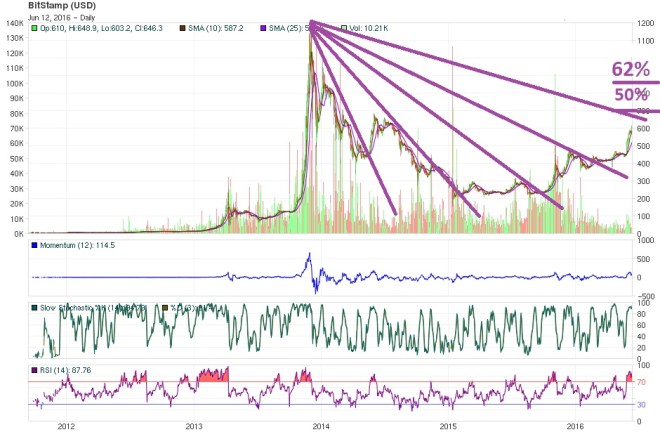

Prices are breaking at every resistance placed by Gann Angles Theory, and also had left back the big triangle accomplishing all the technical objectives.
Taking on all the historical prices data, Fibonacci numbers at the 50% zone would be reached at $670, and the last forecasting on 62% is placed at $820, climbing to $1000 following the round numbers theory.
When we focus on the current recovering movement, the mathematical indicators still show strong signals to the bull market.
But the bubble is on, and every stop loss could follow the climb, producing an approximate 5% pull back. The present rise is just a long term technical correction from the bear market that started in November 2013, and finished in January 2015.
This long-term, upwards correction is about to end with a new correction to $600 as the current big support, likely creating a sideways lateral market and starting a new technical cycle from the new $600 level.
Midterm Analysis
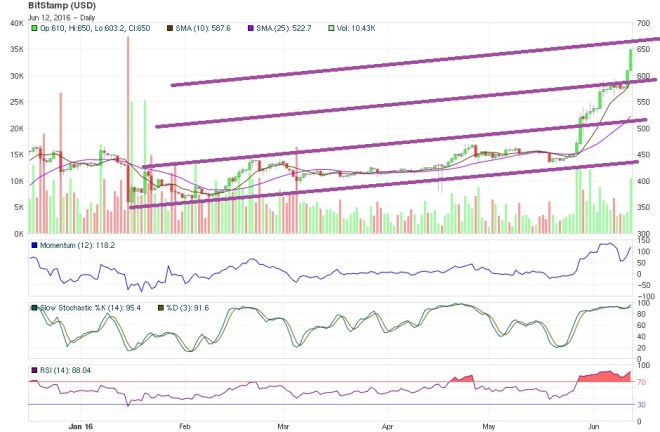
After successive up-breaking, resistance quotes are arriving to a distribution zone, which could be between $670 and $820 due to long-term Fibonacci numbers indicating this up correction from the bear market which took place in 2014.
Now the strongest support shows itself at the recent broken resistance on $600, fixing trading activity among $670 and $820. According to indicators, the strong demand would let prices reach a new level to the up side buy that would be considered a distribution zone because of the overbuying signals from main volatility oscillators.
While investors is focus their math on the 100 level, moving stop losses are recommended on 5% spread behind spot prices, leaving time to accomplish the end of the present cycle, which could happen in July 2016 or at $820.
Short-Term Analysis
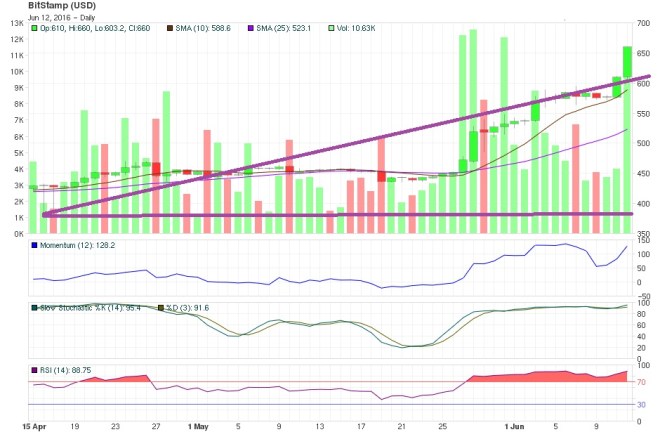
The rising support at $600 seems to be strong enough, and prices still climbing over the 670 level trying to accomplish the long-term Fibonacci numbers at $820 level.
The distribution zone among 670 and 820 could be big enough to take the prices back to 600, creating a lateral sideways market starting a new long term cycle, and closing the current cycle that started on November 2013. This new cycle could have a similar duration as the November 2013 cycle currently coming to a close.
Traders should place moving stop losses at 2, 3 or 5%, but the new lateral sideways movement could have its resistance at $670 after we reach the projected $820 peak. Everybody should wait to sell their positions at $1000, but should also be aware of possible forced stop loss order activations at $820.
Bitcoinist is not responsible for any gains or losses incurred while trading bitcoin. Trade at your own risk.
Article written by Ramiro Burgos.