

- Bitcoin has undergone a strong phase of consolidation over the past week.
- Some fear that this may be a precursor to a strong drop, noting how BTC has formed a swing failure pattern at its highs.
- One analyst says that based on Elliot Wave, Bitcoin could soon move to new all-time highs.
Bitcoin Could Soon Move Past $20,000, Elliot Wave Shows
Bitcoin has undergone a strong phase of consolidation over the past week. The cryptocurrency has traded in an increasingly tight range between $18,500 and $19,500, holding both range boundaries as the market becomes indecisive.
While some think that this is a precursor to a strong drop, an analyst says that more likely than not, Bitcoin will extend higher.
One crypto-asset analyst shared the chart below just recently. It shows that Bitcoin is in the midst of trading in an Elliot Wave pattern, which will potentially resolve in the market moving higher toward $20,000 and beyond.
Elliot Wave is a form of technical analysis that suggests that markets move in predictable waves due to investor psychology and other trends. As Investopedia describes the form of technical analysis further:
“Elliott proposed that financial price trends result from investors’ predominant psychology. He found that swings in mass psychology always showed up in the same recurring fractal patterns, or “waves,” in financial markets.”
Applying this to the Bitcoin chart, the analyst that shared the chart below believes that the market may soon move to a new all-time high:
“What if I told you, this last 3 weeks of sideways movement WAS our major correction? $Bitcoin”

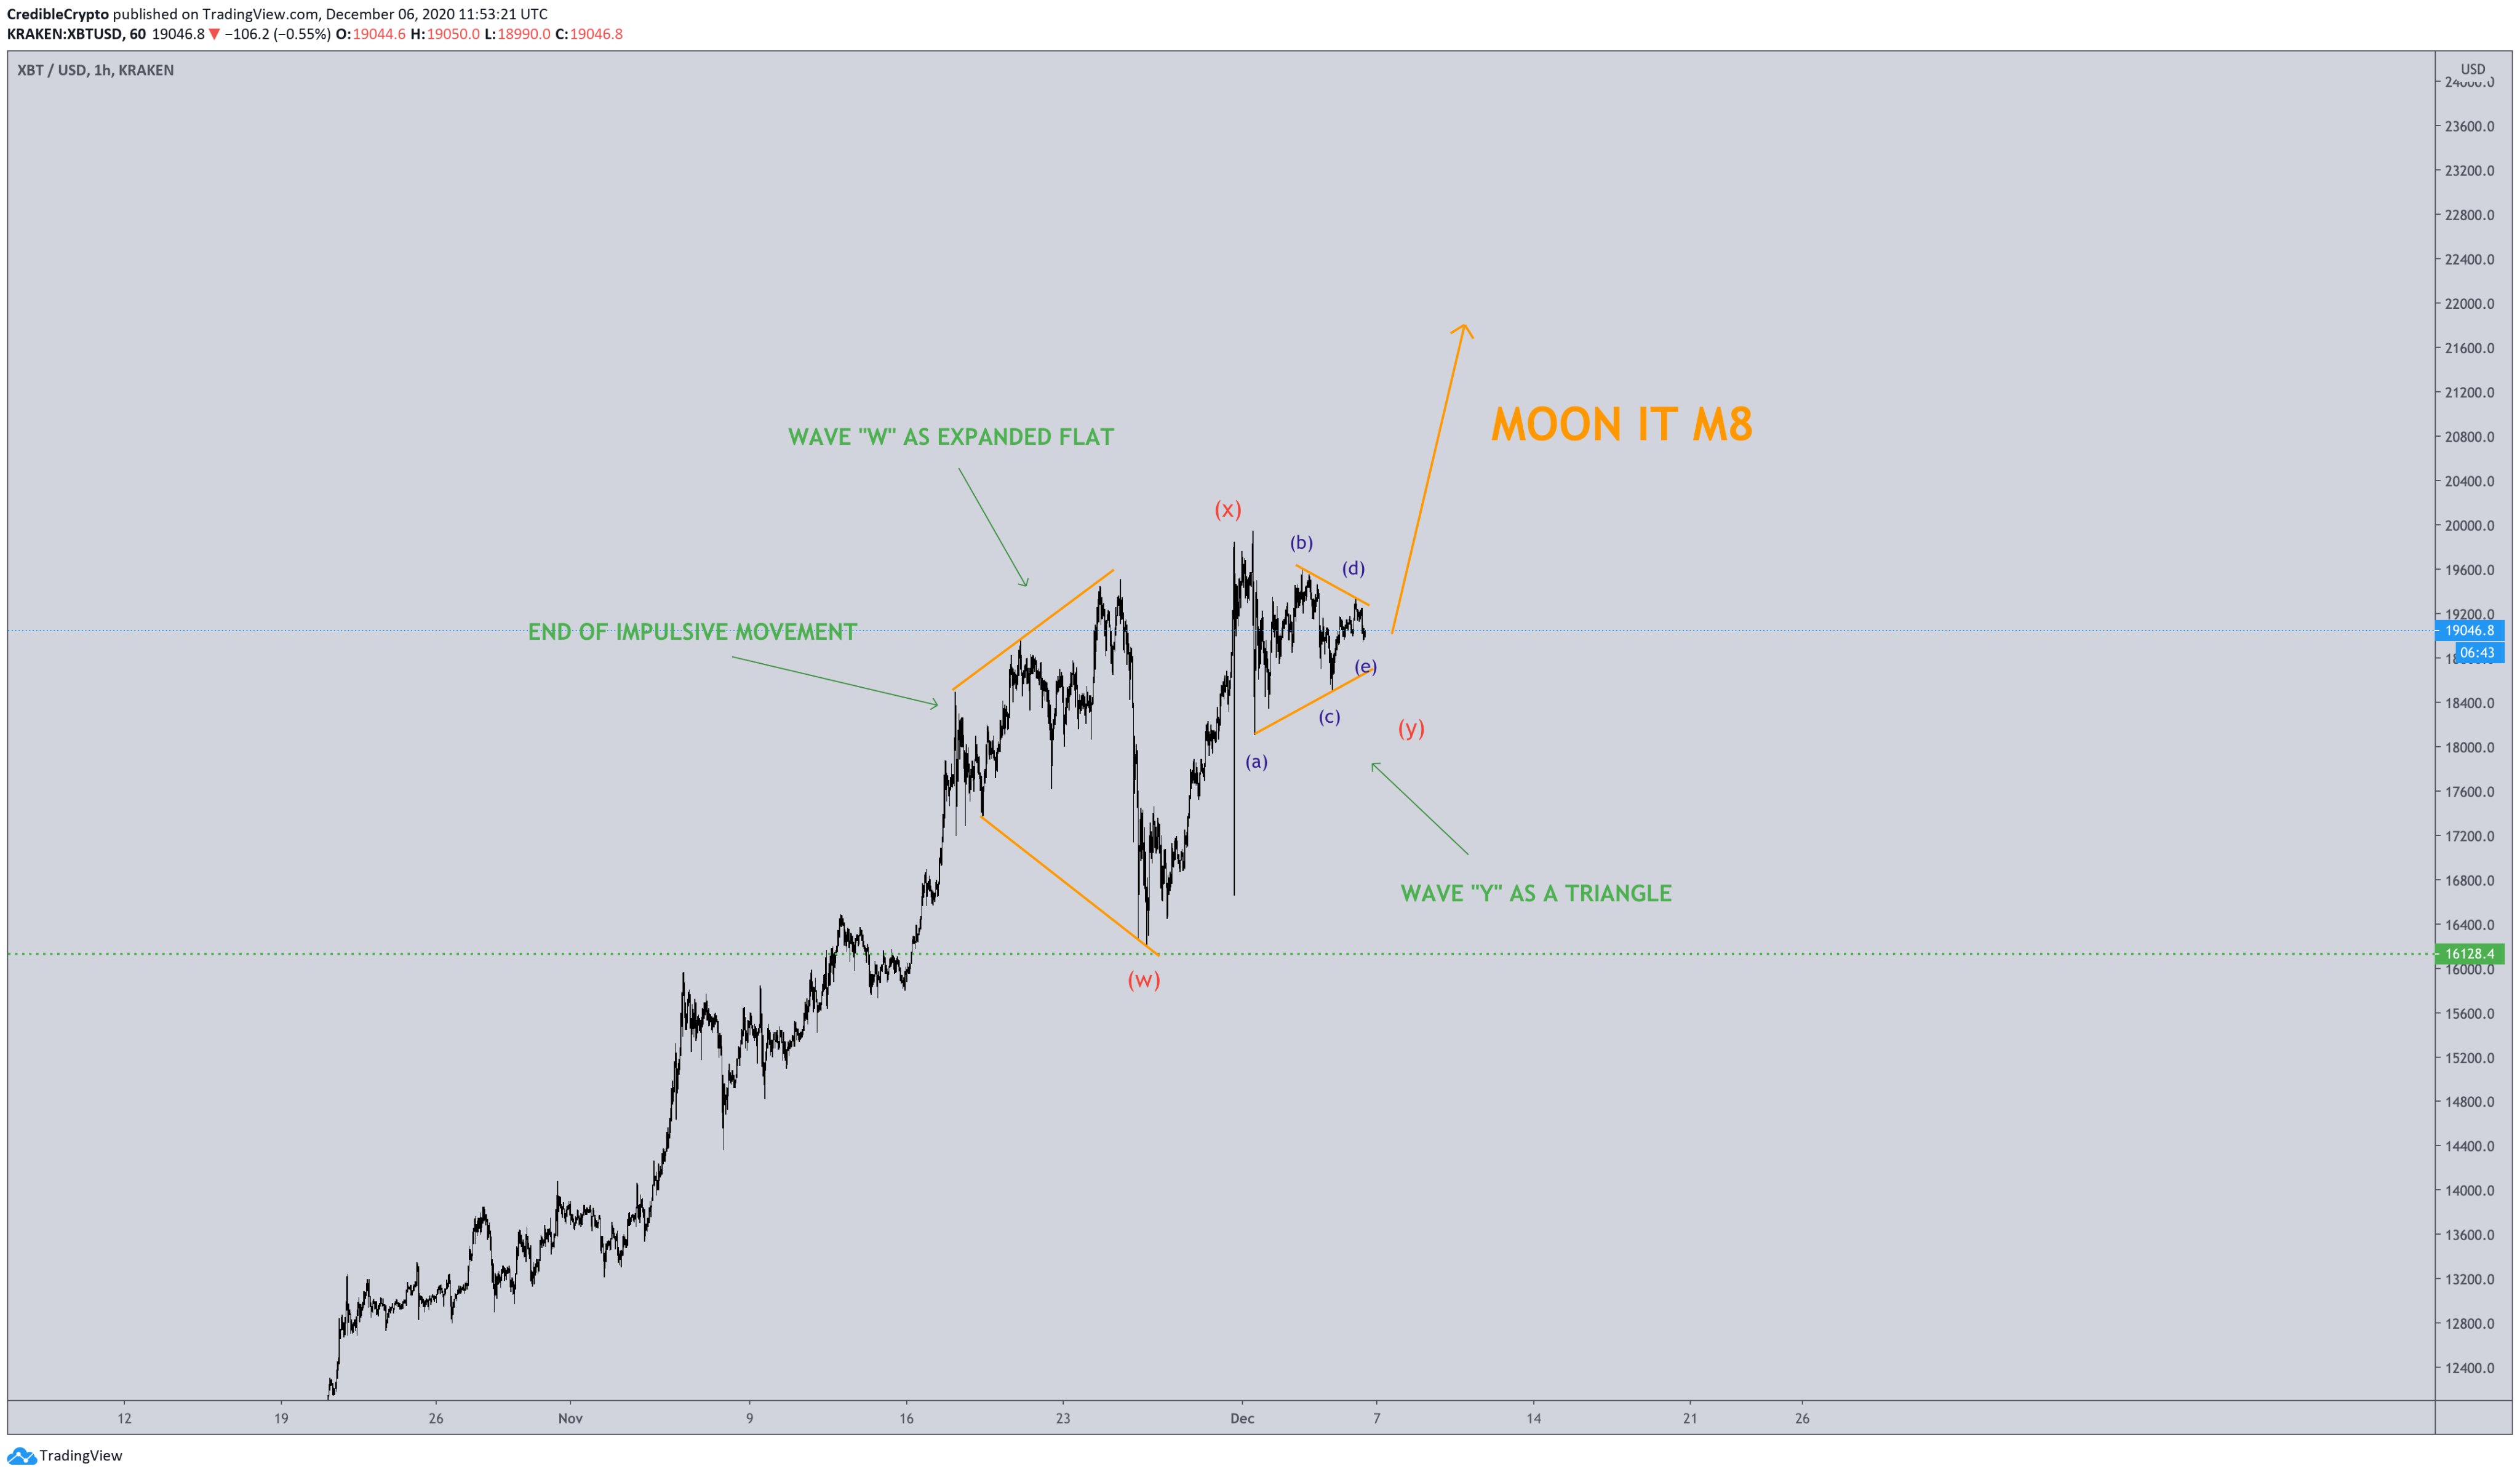
Chart of BTC's price action over the past few weeks with an Elliot Wave analysis by crypto trader Credible Crypto (@CredibleCrypto on Twitter)
Source: BTCUSD from TradingView.com
When?
The next leg that may bring Bitcoin above its $20,000 resistance level may begin in the coming weeks. Crypto-asset analyst Philip Swift noted that over the past four years, BTC has always undergone a crucial reversal in the middle of December, namely between December 15th and 18th:
“The cyclical nature of Bitcoin: 15-18 Dec 2016: Parabolic bull run begins 15-18 Dec 2017: Cycle top 15-18 Dec 2018: Cycle bottom 15-18 Dec 2019: Post Plustoken low 15-18 Dec 2020: ??? Perhaps nothing this year OR…small pullback into mid-Dec before new parabolic bull run?”
This cycle would suggest that Bitcoin may undergo the start of its next exponential cycle come the middle of December.

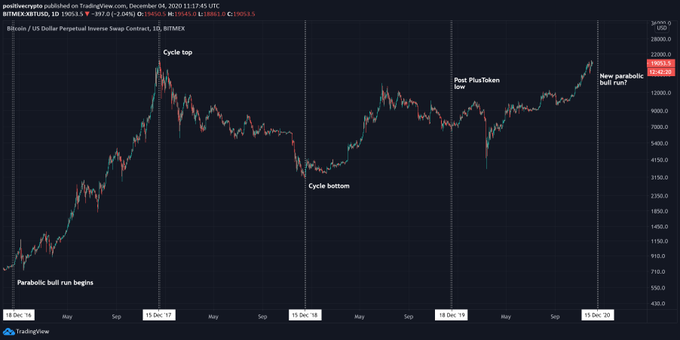
Chart of BTC's price action over the past few years with a cycle analysis by crypto trader Philip Swift (@PositiveCrypto on Twitter)
Source: BTCUSD from TradingView.com
Featured Image from Shutterstock
Price tags: xbtusd, btcusd, btcusdt
Charts from TradingView.com
Wave Analysis Predicts Bitcoin Could Soon Move Above $20,000