
The cost of one Bitcoin could end up plunging below its 2017’s record high of $20,000.
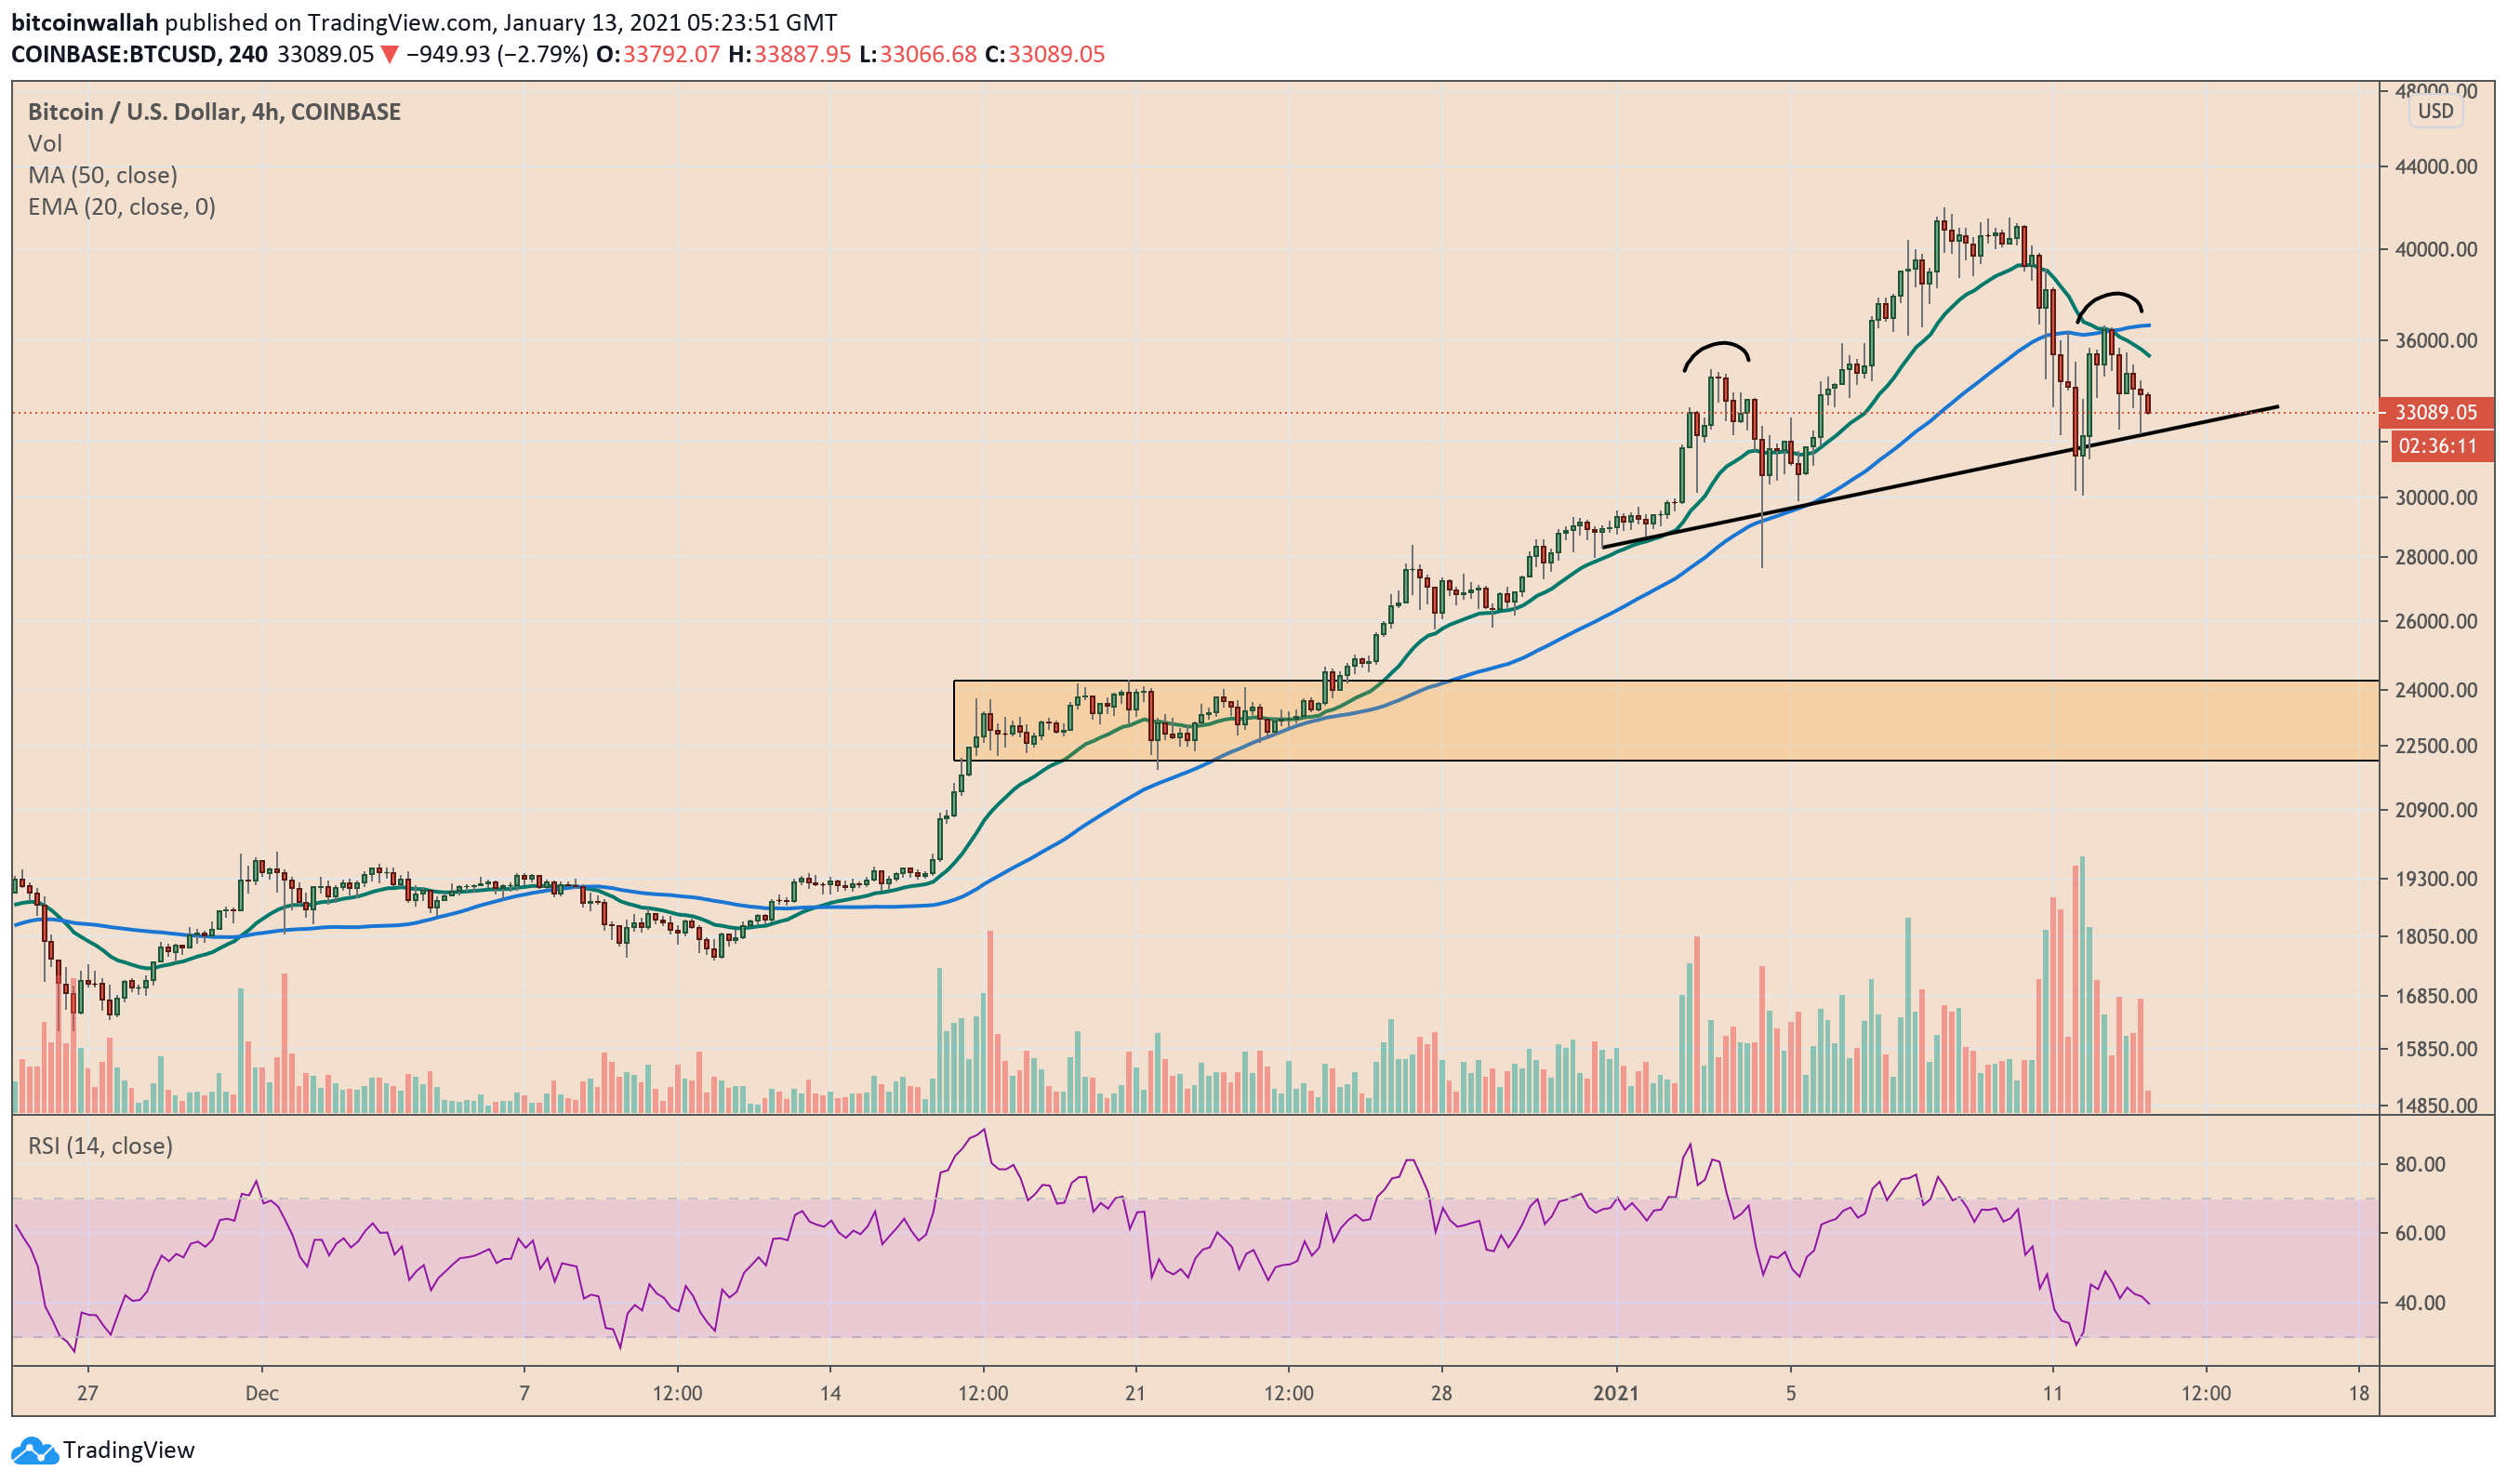
That is, according to a pseudonymous analyst, who determined the cryptocurrency’s bearish outlook based on a classic head and shoulder pattern. As of early Wednesday, BTC/USD had painted four out of five key components that confirm the said reversal indicator. They included three peaks with the middle one larger than the others, supported by a so-called neckline.
“If we are going to below $30,000, the previous [neckline] support will turn into resistance […] We could fulfill the H&S pattern’s price target, which could take the price below the $20,000 level,” the analyst warned.
On-Chain Bitcoin Metrics Bearish
The statements appeared following Bitcoin’s latest pullback from its sessional resistance area above $36,000. The price plunged to as low as $32,309 on the Coinbase exchange as traders assessed profit-taking scenarios.
That was visible in Bitcoin’s on-chain metrics. Ki-Young Ju, the chief executive of blockchain analytics firm CryptoQuant, confirmed that the latest BTC/USD correction coincided with miners dumping their holdings. Meanwhile, exchanges witnessed fewer stablecoin deposits, and the Bitcoin flow into the over-the-counter wallets slowed down throughout this week.
“We might have second dumping,” stated Mr. Ju just right before BTC/USD plunged towards $32,000.
Nothing has been changed since yesterday.
Miners are selling, no significant #stablecoin inflows, no #Coinbase outflows, and 15k $BTC flowed into exchanges since yesterday.
We might have second dumping.
Chart 👉 https://t.co/X0Uf3Sxa3S pic.twitter.com/MkAHRklUoy
— Ki Young Ju (@ki_young_ju) January 12, 2021
Pattern Timeframe
Mainstream traders and analysts agree that a meaningful price reversal is less likely to emerge from a shorter-term Head and Shoulder pattern—the one spanning between a day to three weeks. Meanwhile, the longer-term patterns active for at least six months mark the return of bears.
“The head & shoulders pattern can develop over virtually any timeframe,” analysts at Schwab stated. “However, most traders believe that patterns that take a longer time to form are more significant and more likely to identify a meaningful price reversal.”
Volume is likely to play a key factor in determining Bitcoin’s current H&S pattern. A breakdown below the neckline support accompanied by a spike in trades would more likely validate $20,000 as its downside target. On the other hand, meager volumes on any negative breakout would mean a rebound towards $35,000.
Meanwhile, analyst Jonny Moe sees a bullish reversal, noting that the H&S pattern may turn out to be an Ascending Channel indicator.
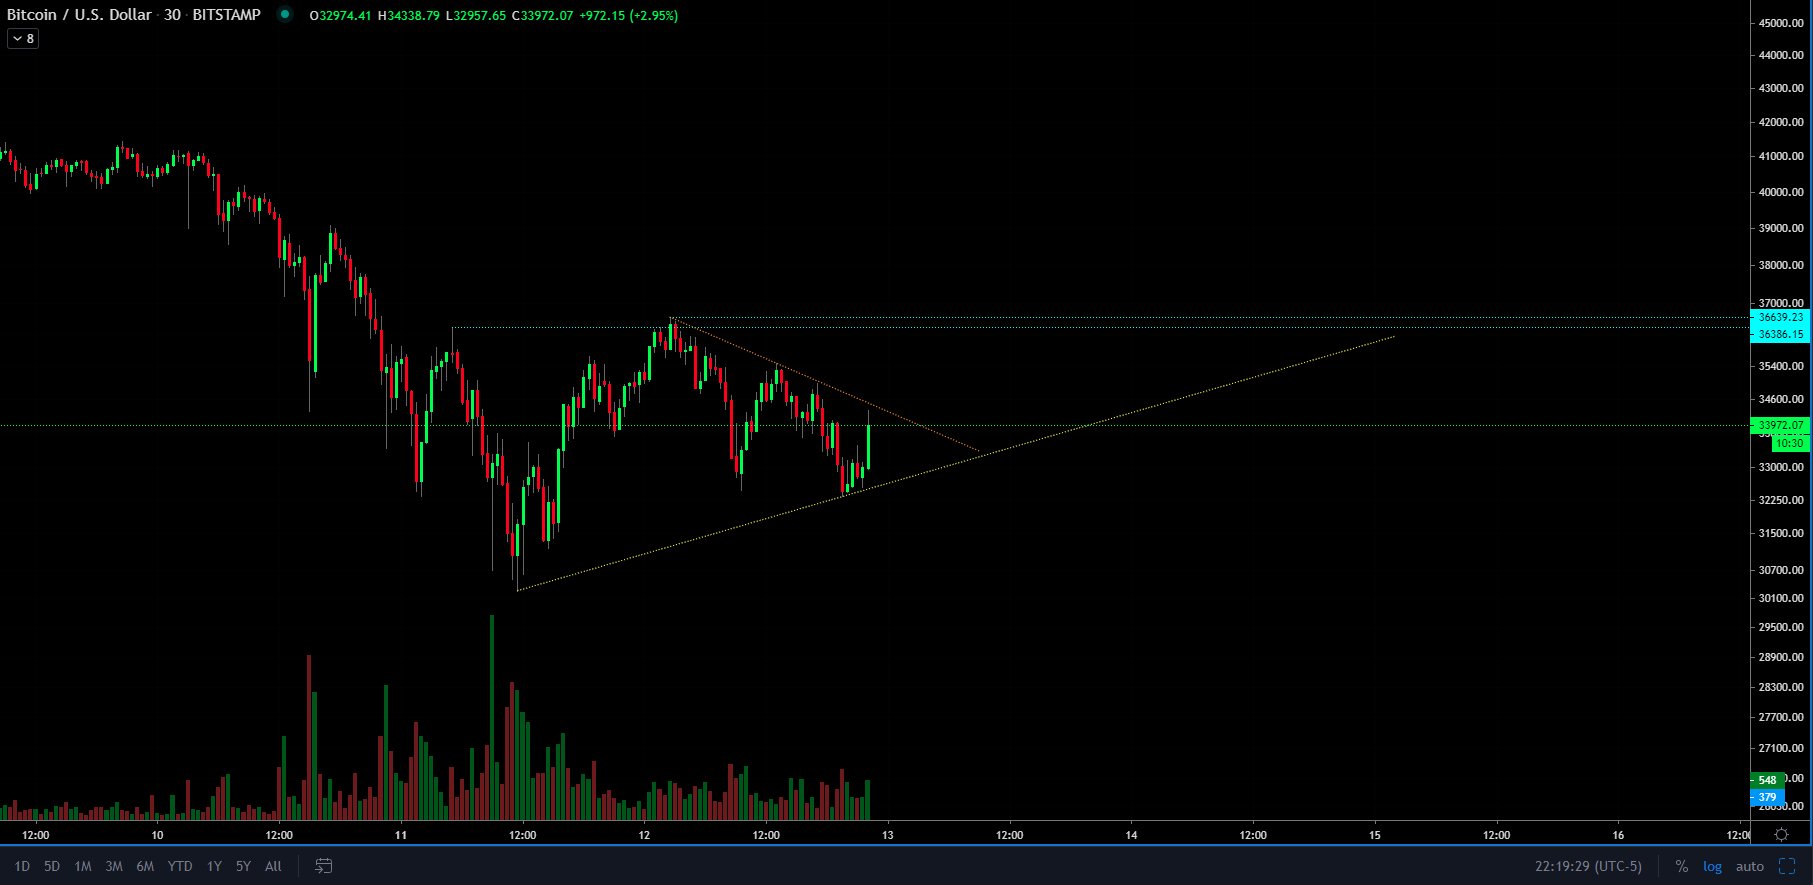
“Worth noting we’re still inside this more localized downtrend,” he explained. “[I] would like to see this downtrend broken to add a little more pattern confidence.”