

These days, the use of technical analysis (TA) tools or indicators has become a part of the day trading paradigm. Even for cryptocurrency day trading, these indicators can help to supplement analysis leading to a greater probability of successfully earning a profit.
Cryptocurrency Day Trading
With day trading it is all about maximizing the outcome of price fluctuations in the asset that occur within a single day’s trading. For a volatile asset class like cryptocurrency, this brings up the potential for significant gains, as well as, devastating losses.
The SimpleFX WebTrader affords traders the opportunity to make money off the volatility of cryptocurrencies like Bitcoin. With day trading, it can be argued that the traders’ destiny is in his/her own hands unlike ‘hodling’ – buying and holding cryptocurrency for a period, in anticipation of a significant price increase.
In 2018, many hodlers, especially those who bought during the height of cryptomania would have seen their holdings diminish spectacularly as cryptocurrency prices have taken a significant tumble throughout the year. Whereas, the story isn’t so for day traders who are only concerned with the performance of a coin within a single day’s trade.
Technical Analysis
In simple terms, TA is a way of knowing when to make buy/sell decisions based on market trends (indicators). It requires pouring over charts and stats trying to predict what the price trajectory of the cryptocurrency will be; upward or downward. As far as cryptocurrency day trading is concerned, the following are some of the best technical analysis indicators as seen on the SimpleFX WebTrader.
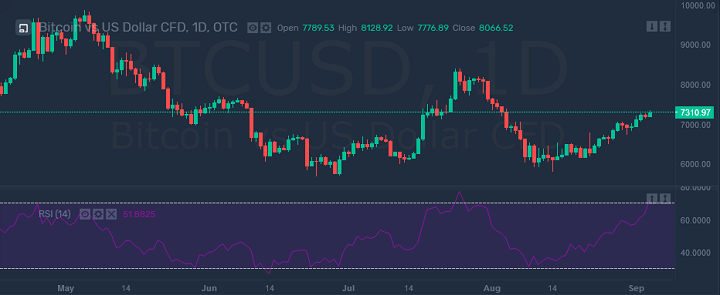
RSI
RSI stands for Relative Strength Index and is a momentum indicator which means that it measures the speed of price changes. Thus, the RSI provides information on whether a particular cryptocurrency is oversold or overbought. The primary assumption that when a cryptocurrency is oversold, its price increases and vice-versa.
Typically, the RSI can be used to locate the tops and bottoms, as well as points of divergence. Simply put, divergence points are points where the RSI tops and bottoms differ from that of the price tops and bottoms.

RSI has a formula which is expressed below:
RSI=100-(100/(1+RS)),
Where RS = Average gain/Average loss
RSI below 30 signifies “oversold” which means price should increase.
RSI above 70 signifies “overbought” which means price should decrease.
MACD
The Moving Average Convergence Divergence or “Mack-Dee” uses the interface between two moving averages (MAs) and a ‘trigger line.’ The two Mas are used to plot a ‘main line,’ and the position of the intersection between both lines indicates whether it is the right time to buy or sell the cryptocurrency.
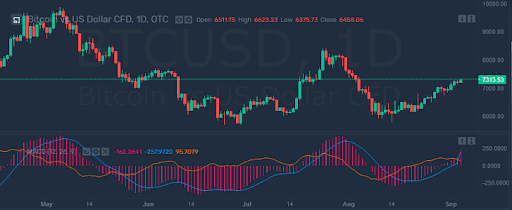

If the main line intersects the trigger line from below, it is seen as a buy signal for the cryptocurrency. If the reverse is the case, then it is interpreted as a sell signal for the cryptocurrency.
Volume
The volume TA tool indicates the amount of the cryptocurrency that has been traded throughout a specific period. It is one of the indicators with the most concurrence with price action – the movement of the cryptocurrency’s price.
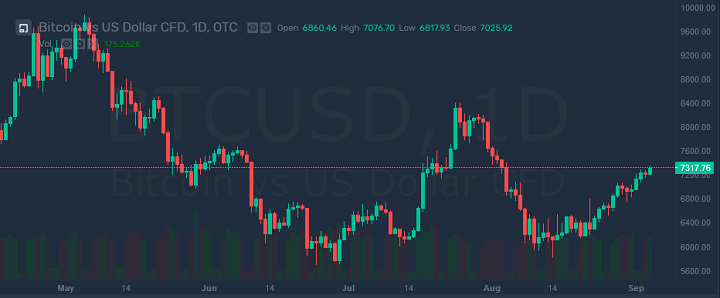

Short-term trading regularly relies on price action for making subjective decisions without having to interpret charts and stats. This where the volume TA tool comes in handy as it can readily supplement a trader’s interpretation of the current price action.
Stochastic Oscillator
Stochastic oscillator is similar to RSI in that it ranges between 0 and 100 and it also signals whether the cryptocurrency is oversold/overbought. However, while RSI considers the rate of price change, the stochastic oscillator examines the support and resistance levels of cryptocurrencies during trading.
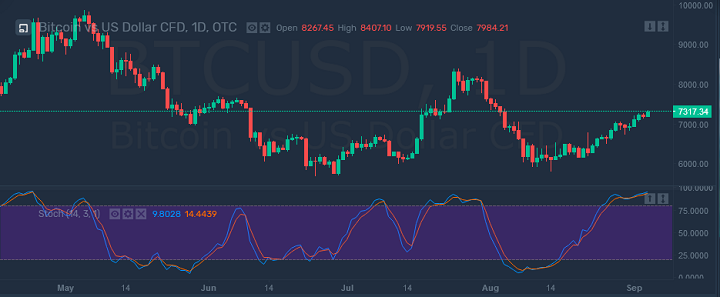

When the stochastic oscillator moves above 80, the cryptocurrency is overbought, meaning an imminent price decrease. When the stochastic oscillator moves below 20, the cryptocurrency is oversold, and the price is expected to increase.
Bollinger Bands
At first glance, a cryptocurrency price chart only tells in what direction the value is moving, upwards or downwards. For traders, this isn’t enough as it is necessary to know the relative price movement – higher/lower highs and lows.
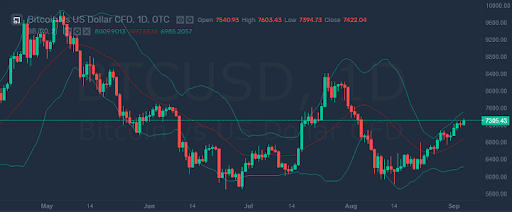

Bollinger bands are essentially price channels plotted both above and below the price of a cryptocurrency. Done properly, Bollinger bands can capture as much as 90 percent of the virtual currency’s price action.
The basic rule of thumb for bbands is the cryptocurrency price nearing the lower band signifies a “buy signal” while the price approaching the upper band is a “sell signal.”
SFX WebTrader Advantages
Apart from the ease of accessing and using these indicators, the newly relaunched, faster, and more intuitive SimpleFX WebTrader platform also has a host of other advantages which include the following:
- Easy to use. The UI isn’t clunky or clustered. It boasts a host of features designed to simplify the web trading process. The platform also offers direct crypto deposits and payouts.
- The platform also has a robust API that enables traders to effectively manage their positions, allowing to quickly and easily read instruments, trades, and prices. The secure API manager also allows advanced users to easily plug-in external automated trading or analytics solutions.
- SimpleFX WebTrader is optimized for every device offering useful charts, trend lines, Fibonacci tools, etc.
- Traders can also use a leverage of up to 1:500 which means that they can trade with positions that are 500 times larger than their deposits. Thus, if a trader chooses to use the 1:500 leverage option, if they deposit $1,000 into their account on SFX, they can trade with $500,000. This allows for the possibility of higher profits.
With the SimpleFX WebTrader, cryptocurrency day trading can be a breeze with its rich UI and assortment of important TA indicators.
What do you think about the SimpleFX WebTrader and its catalog of helpful TA tools? Please let us know the comment section below.