

Bitcoin bulls should prepare for its price to drop into the $35,000-40,000 area, per an apprehensively accurate fractal.
First highlighted by TradingShot, an independent crypto trading consultancy, the fractal relies on a flurry of technical indicators to make its short-term bearish case. They include a so-called pitch-fan, three moving averages, and two momentum indicators. All of them have predicted Bitcoin’s short- and medium-term trends in the recent sessions.
The TradingShot study focuses on the support and resistance levels that constitute the pitch-fan. In it, Bitcoin’s every higher high formation leads to an upside rejection at the upper band or the median. Meanwhile, the lower band provides the much-required support to resume the uptrend, as shown in the chart below.
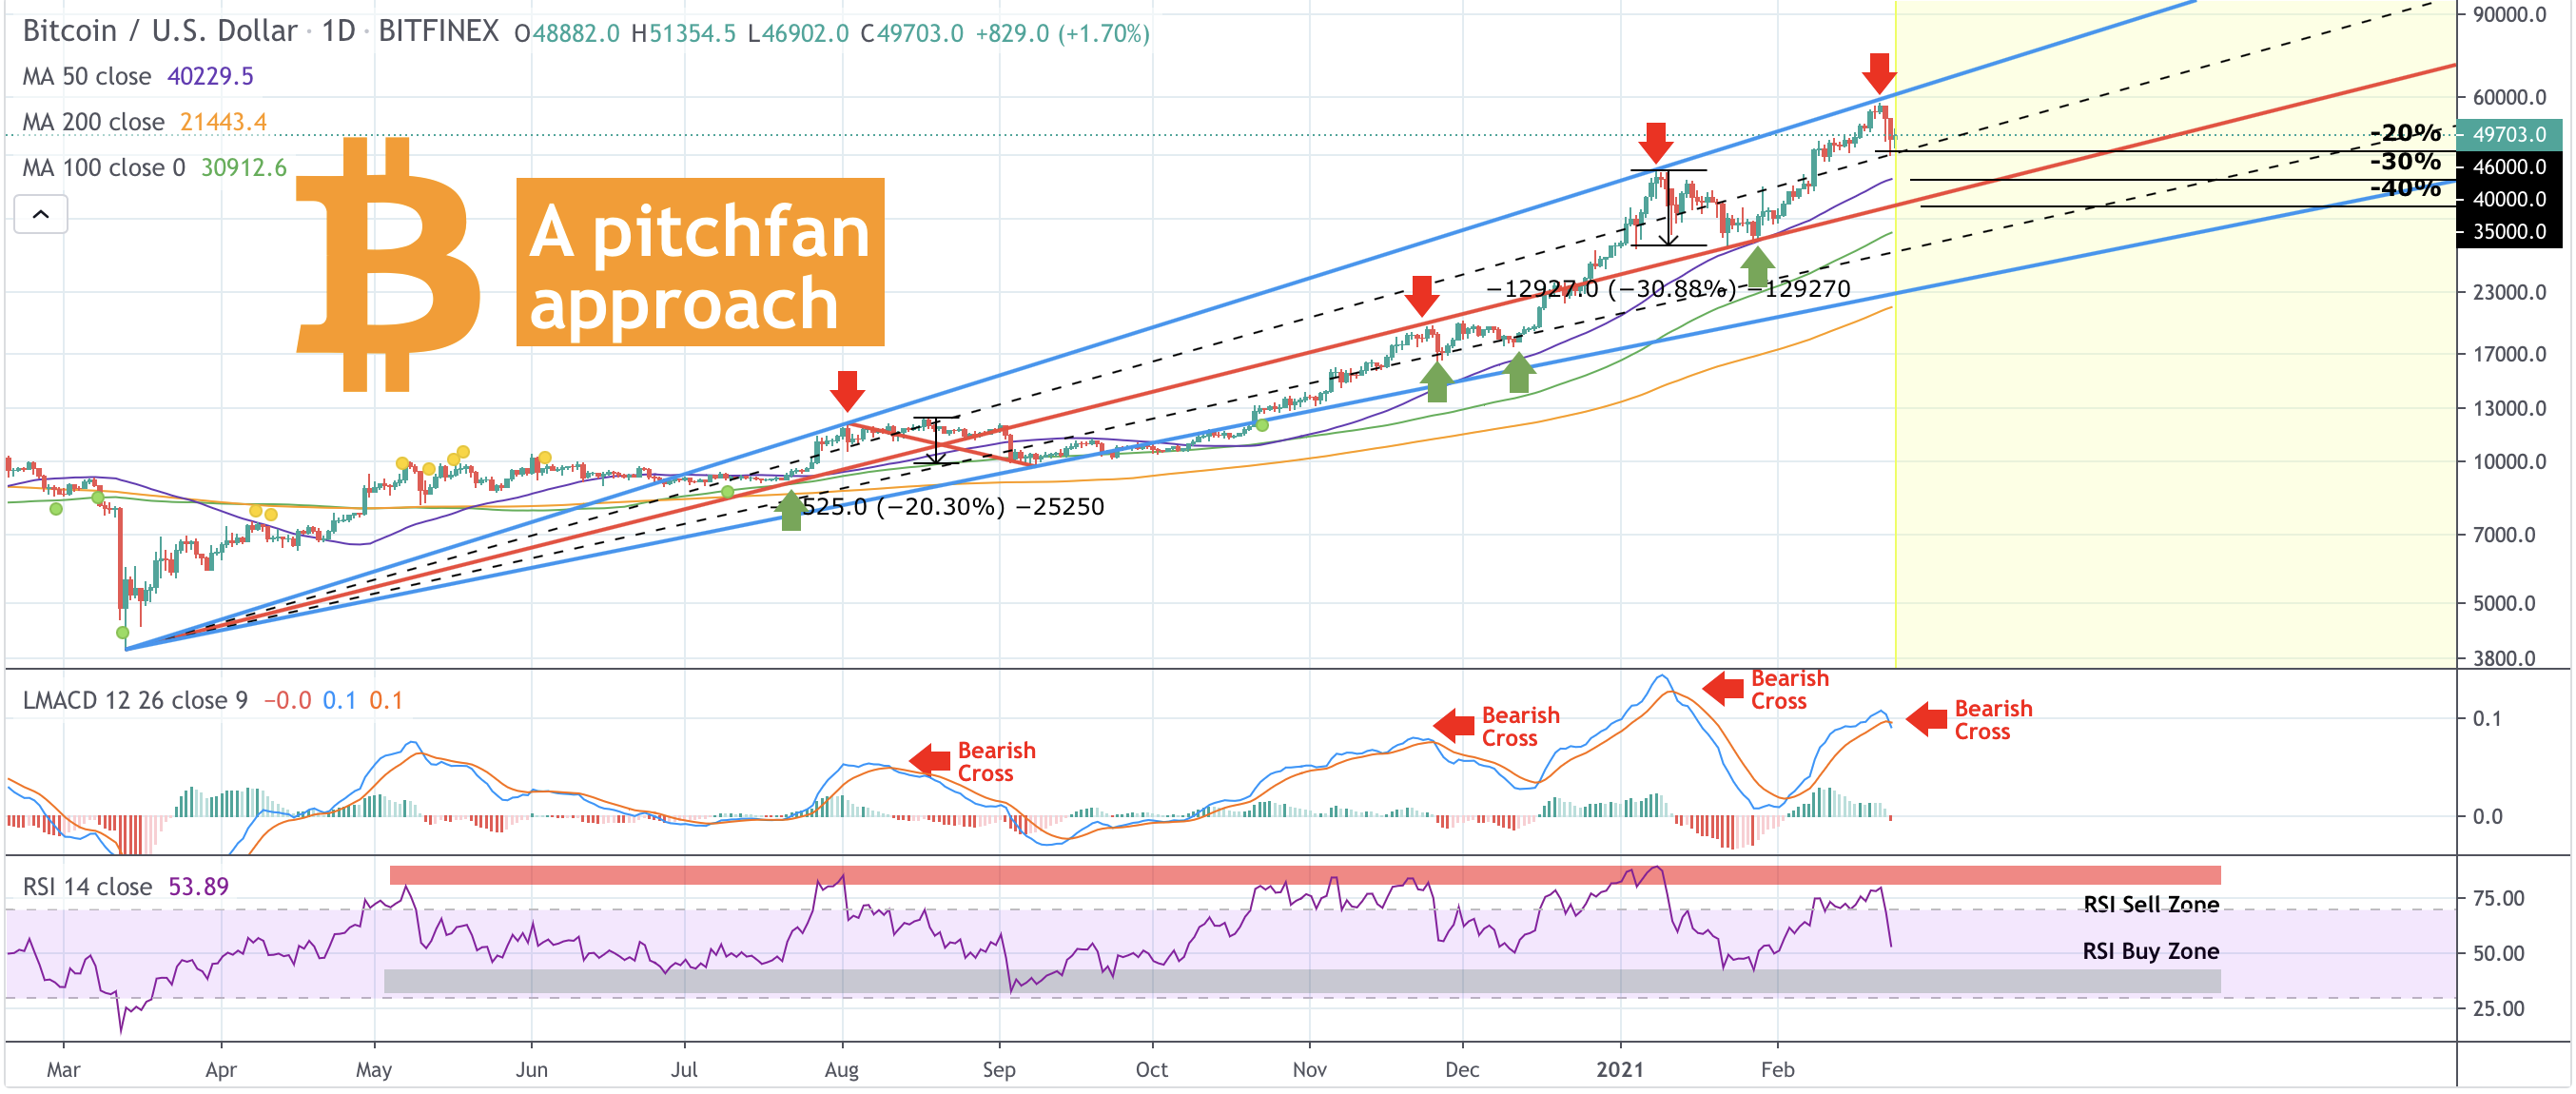
“A moderate projection shows that the median (red line) within 2-3 weeks can again provide support, this time making contact with the 1D MA100 (green trend-line),” noted the TradingShot analysts.
“The dotted lines are the 0.5 levels and have been supporting since November 10, 2020. Contact with the lower 0.5 bands will be a -40 percent correction, which only happened once during the 2017 Parabolic Run,” they added.
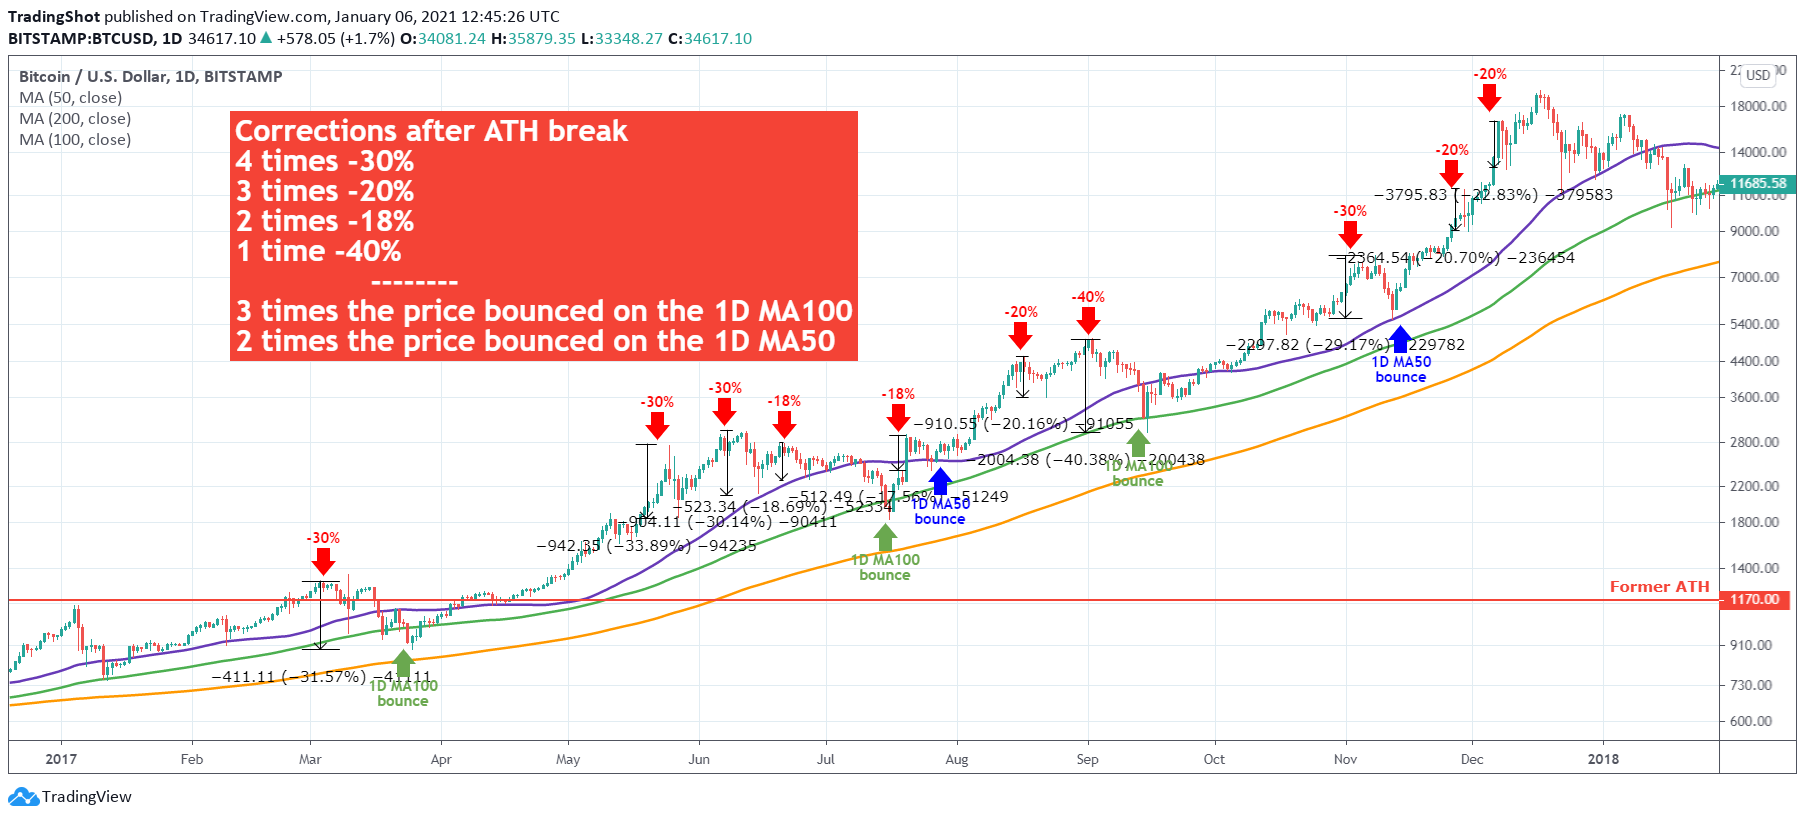
In retrospect, each of Bitcoin’s corrections from local tops tested the 1D MA100 thrice and the 1D MA50 twice as support since December 2017. Currently, the 1D MA100 level sits near $40,000 while the 1D MA50 is near $35,000.
More Bearish Cues
The possibility of Bitcoin correcting into the $35,000-40,000 region also increased due to a bearish LMACD indicator, a backronym for “Logarithmic Moving Average Convergence Divergence.”
In retrospect, the LMACD represents the logarithmic difference between Bitcoin’s 12-period moving average and its 26-period moving average. When LMACD slips below the 9-period moving average, it signals a bearish crossover. Conversely, when MACD breaks above the 9-period MA, it alerts about a bullish crossover.
The Bitcoin chart above shows the LMACD forming a bearish crossover, pointing to an extended sell-off in the coming sessions. That suits the pitch-fan theory.
“Every such prior formation not only came shortly after a Top but was also a Higher High on the Pitchfan,” the TradingShot analysts said. “The RSI got rejected just before entering its multi-month Sell Zone (Resistance) and is fast approaching its Buy Zone (Support). Notice how every hit on the RSI Buy Zone has been a Bottom.”
Bitcoin Long-Term Setup
TradingShot remained biased towards bulls from a long-term perspective, expecting that a lower probability of 40 percent correction would assist Bitcoin in resuming its upside run. The firm recommended traders time plan their bitcoin purchases near the provable support levels.
“We still have the better part of this Bull Cycle ahead of us,” it added.