After Bitcoin has staged a substantial rally of 29% since the beginning of the year, investors are speculating about whether this is a bull trap or actually the beginning of a new bull market. Currently, there is still a lot of skepticism among analysts about whether Bitcoin has really found its bottom.
To answer this question, the renowned on-chain analysis company Gassnode published today a list of 10 indicators to answer the most pressing question of all. As the company notes, there is “no single silver bullet to accomplish this task.”
However, the 10 indicators can provide a clue as to whether Bitcoin is nearing the end of its bear market. According to Glassnode’s analysis, four indicators already confirm the end, while two indicators are “in progress,” and four indicators in turn have not yet been triggered.
Bullish Indicators For Bitcoin
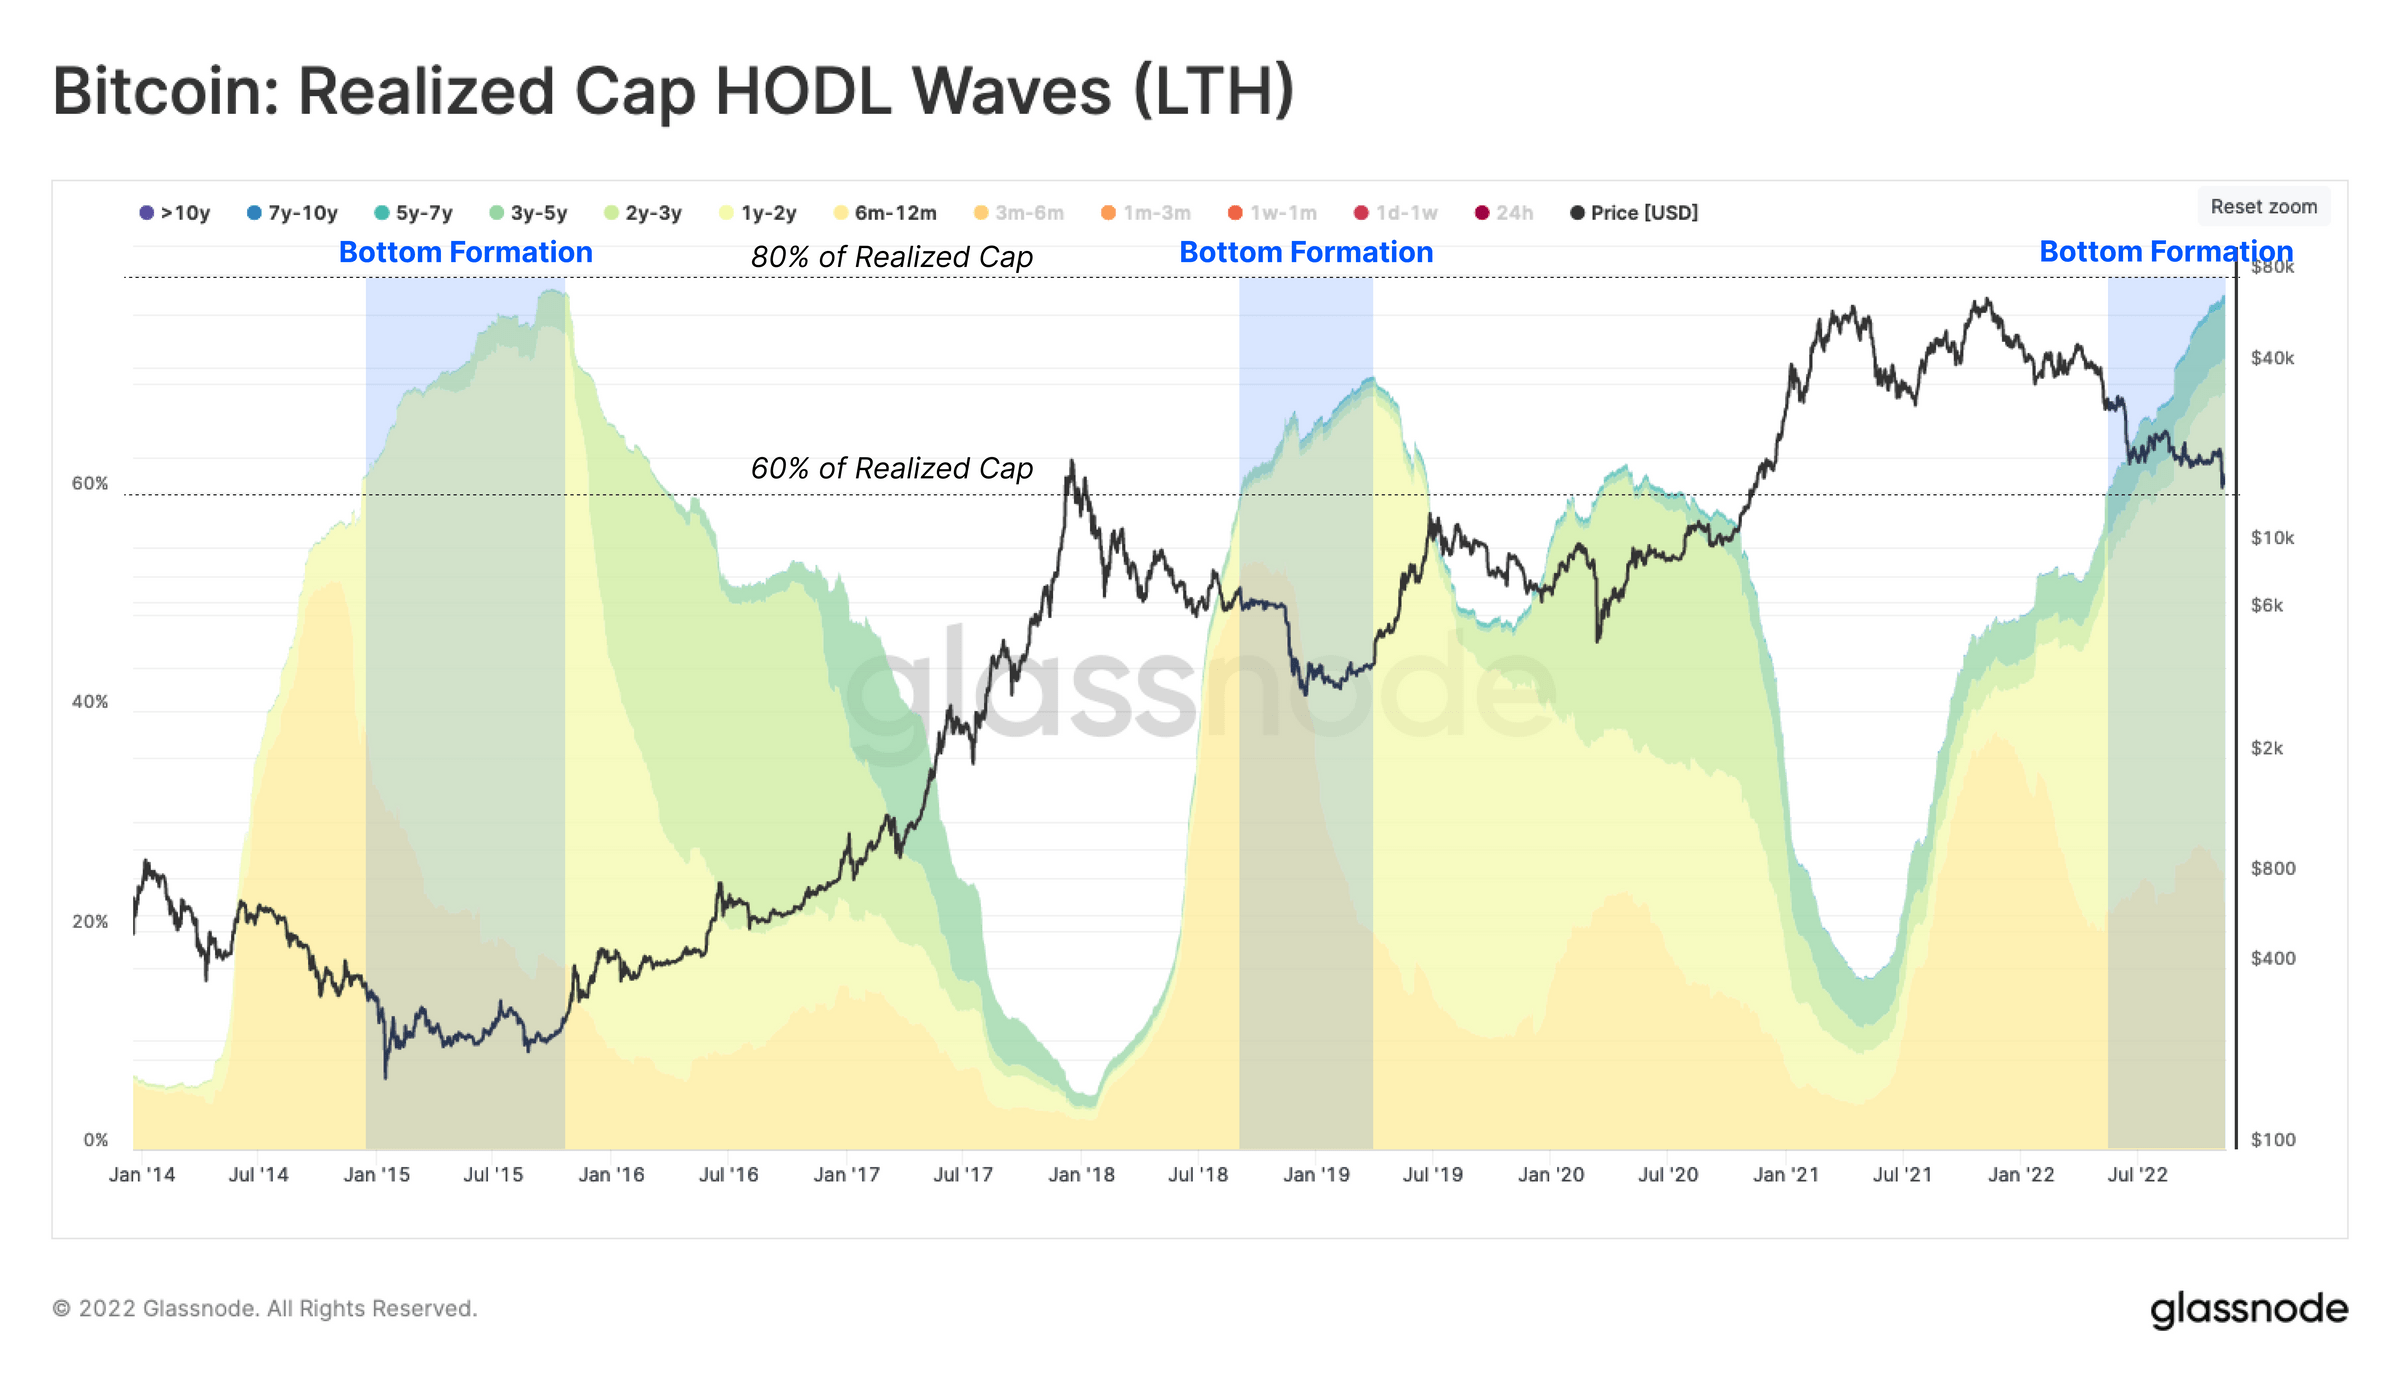
The first indicator, which has already been triggered, is Realized Cap HODL Waves (LTH). The indicator states that historically, an intersection between the Realized Price * 0.7 and the 200D SMA * 0.6 price model occurs during the lowest phases of bear markets.

A second indicator that the bear market is ending is a healthy increase in miner revenues, signaling a competitive fee market. According to Glassnode, the 90-day SMA of miner fee revenue has exceeded the 365-day SMA. This suggests that there is a “constructive uptick in blockspace congestion.”
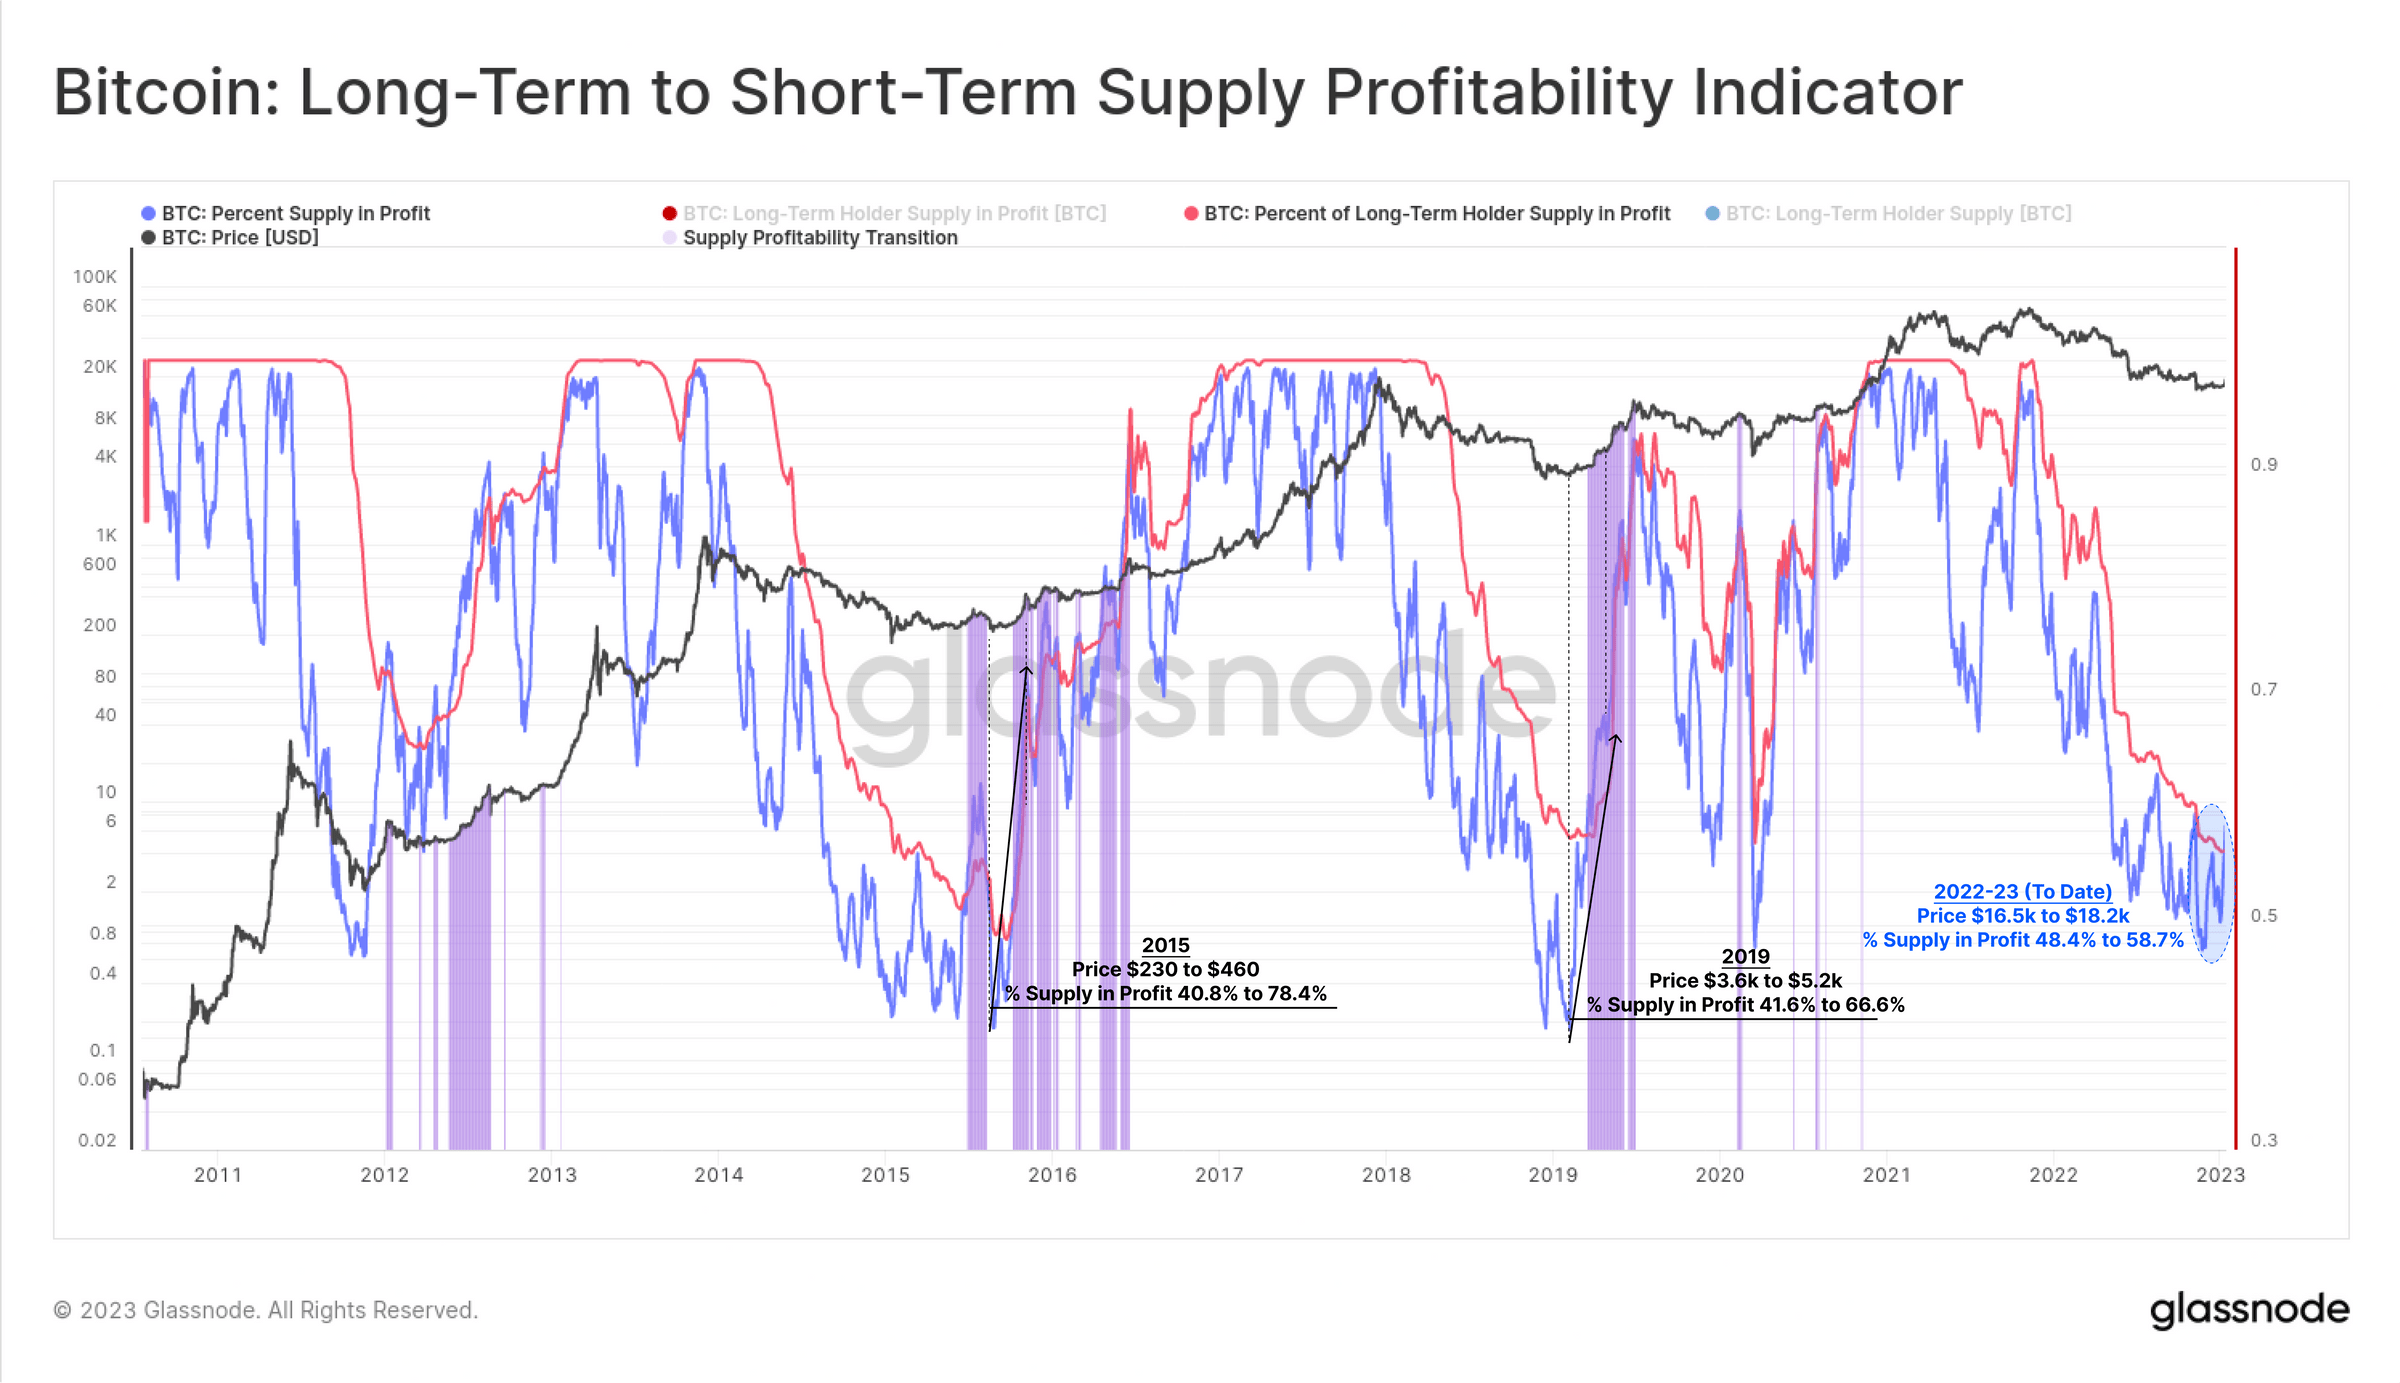
Also fully confirmed is the Long-Term To Short-Term Profitability Indicator. The metric signals that a large number of coins have changed hands at low prices. This creates a “solid foundation” for bull cycles as this creates a realignment of the average market cost base to cheaper and lower prices.

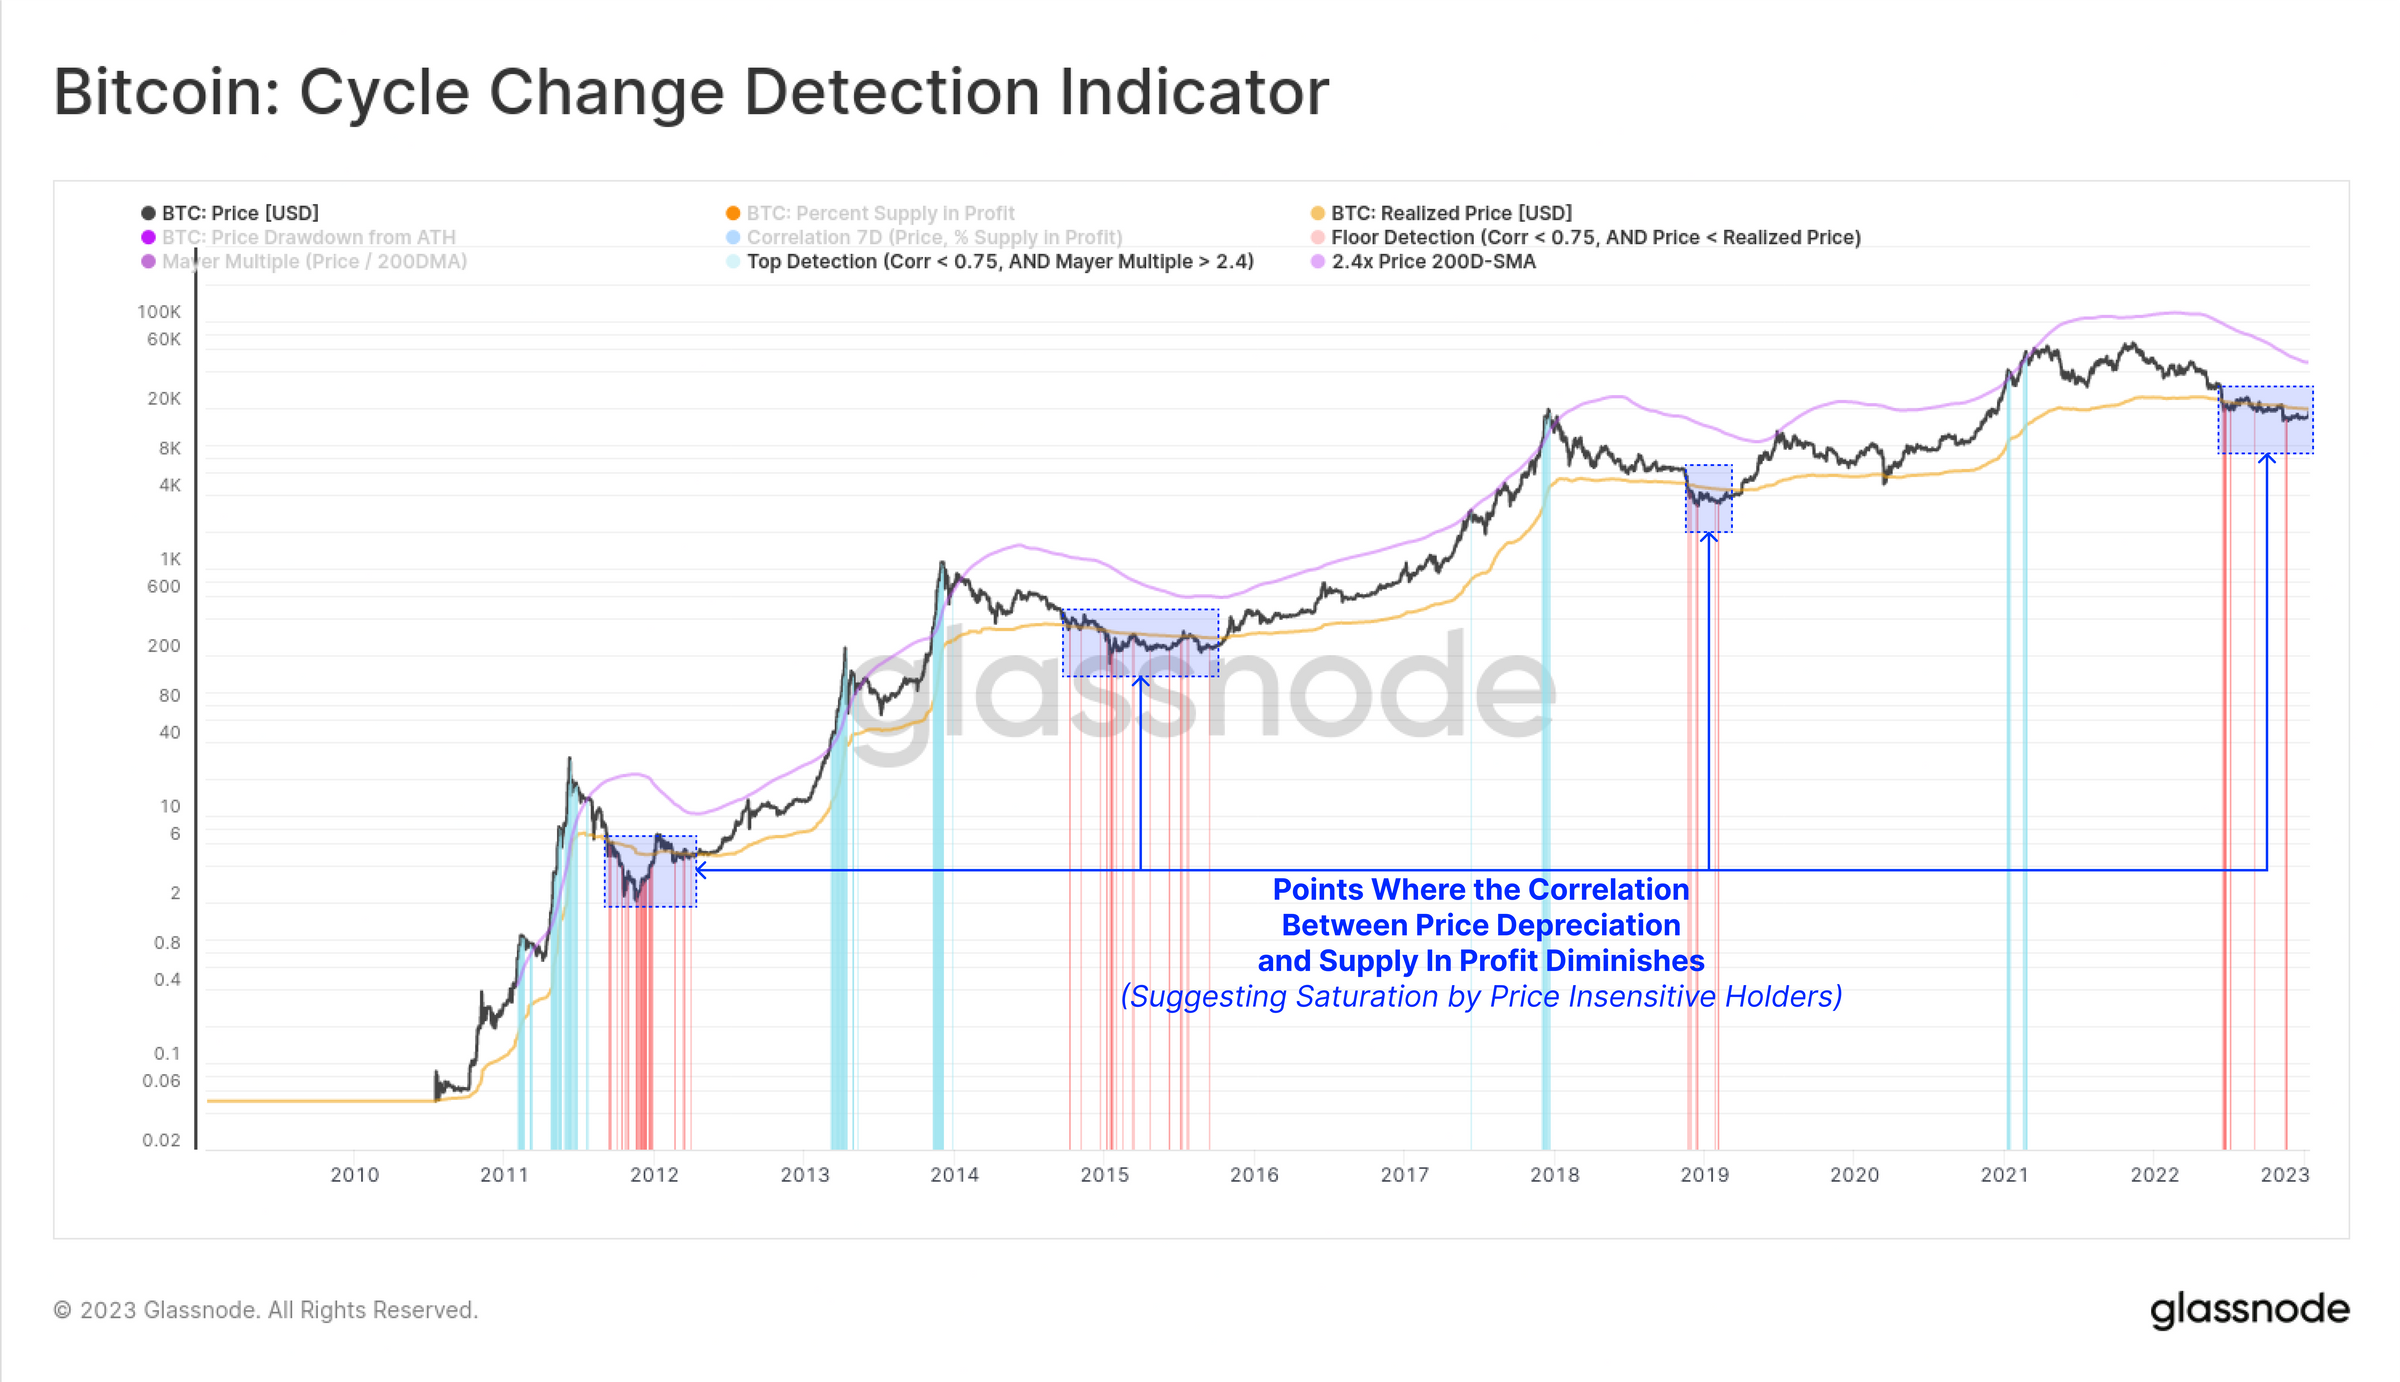
Last but not least, the “Bitcoin Cycle Change Detection Indicator” has also been fully triggered. The metric shows that the point has been reached where the correlation between price depreciation and supply in profit is diminishing, indicating saturation by price-insensitive holders.
In the process of being confirmed is the New Address Momentum indicator, which shows a sustainable market recovery due to the increase in network activity. According to Glassnode, this occurs when the 30-day SMA of new addresses exceeds the 365-day SMA and holds for at least 60 days.
“An initial burst of positive momentum occurred in early November 2022. However, this has been sustained for only one month so far,” says Glassnode.
Also not yet confirmed is the Supply Stress Ratio Indicator. In deep bear market phases, this metric reaches a drastic drop below 1.0, reflecting that the “weak hands” are being flushed out of the market.
The “ratio is currently within the peak market stress regime that has historically been sufficient to shake out a majority of investors,” according to the research firm.
Indicators For A Bearish Scenario
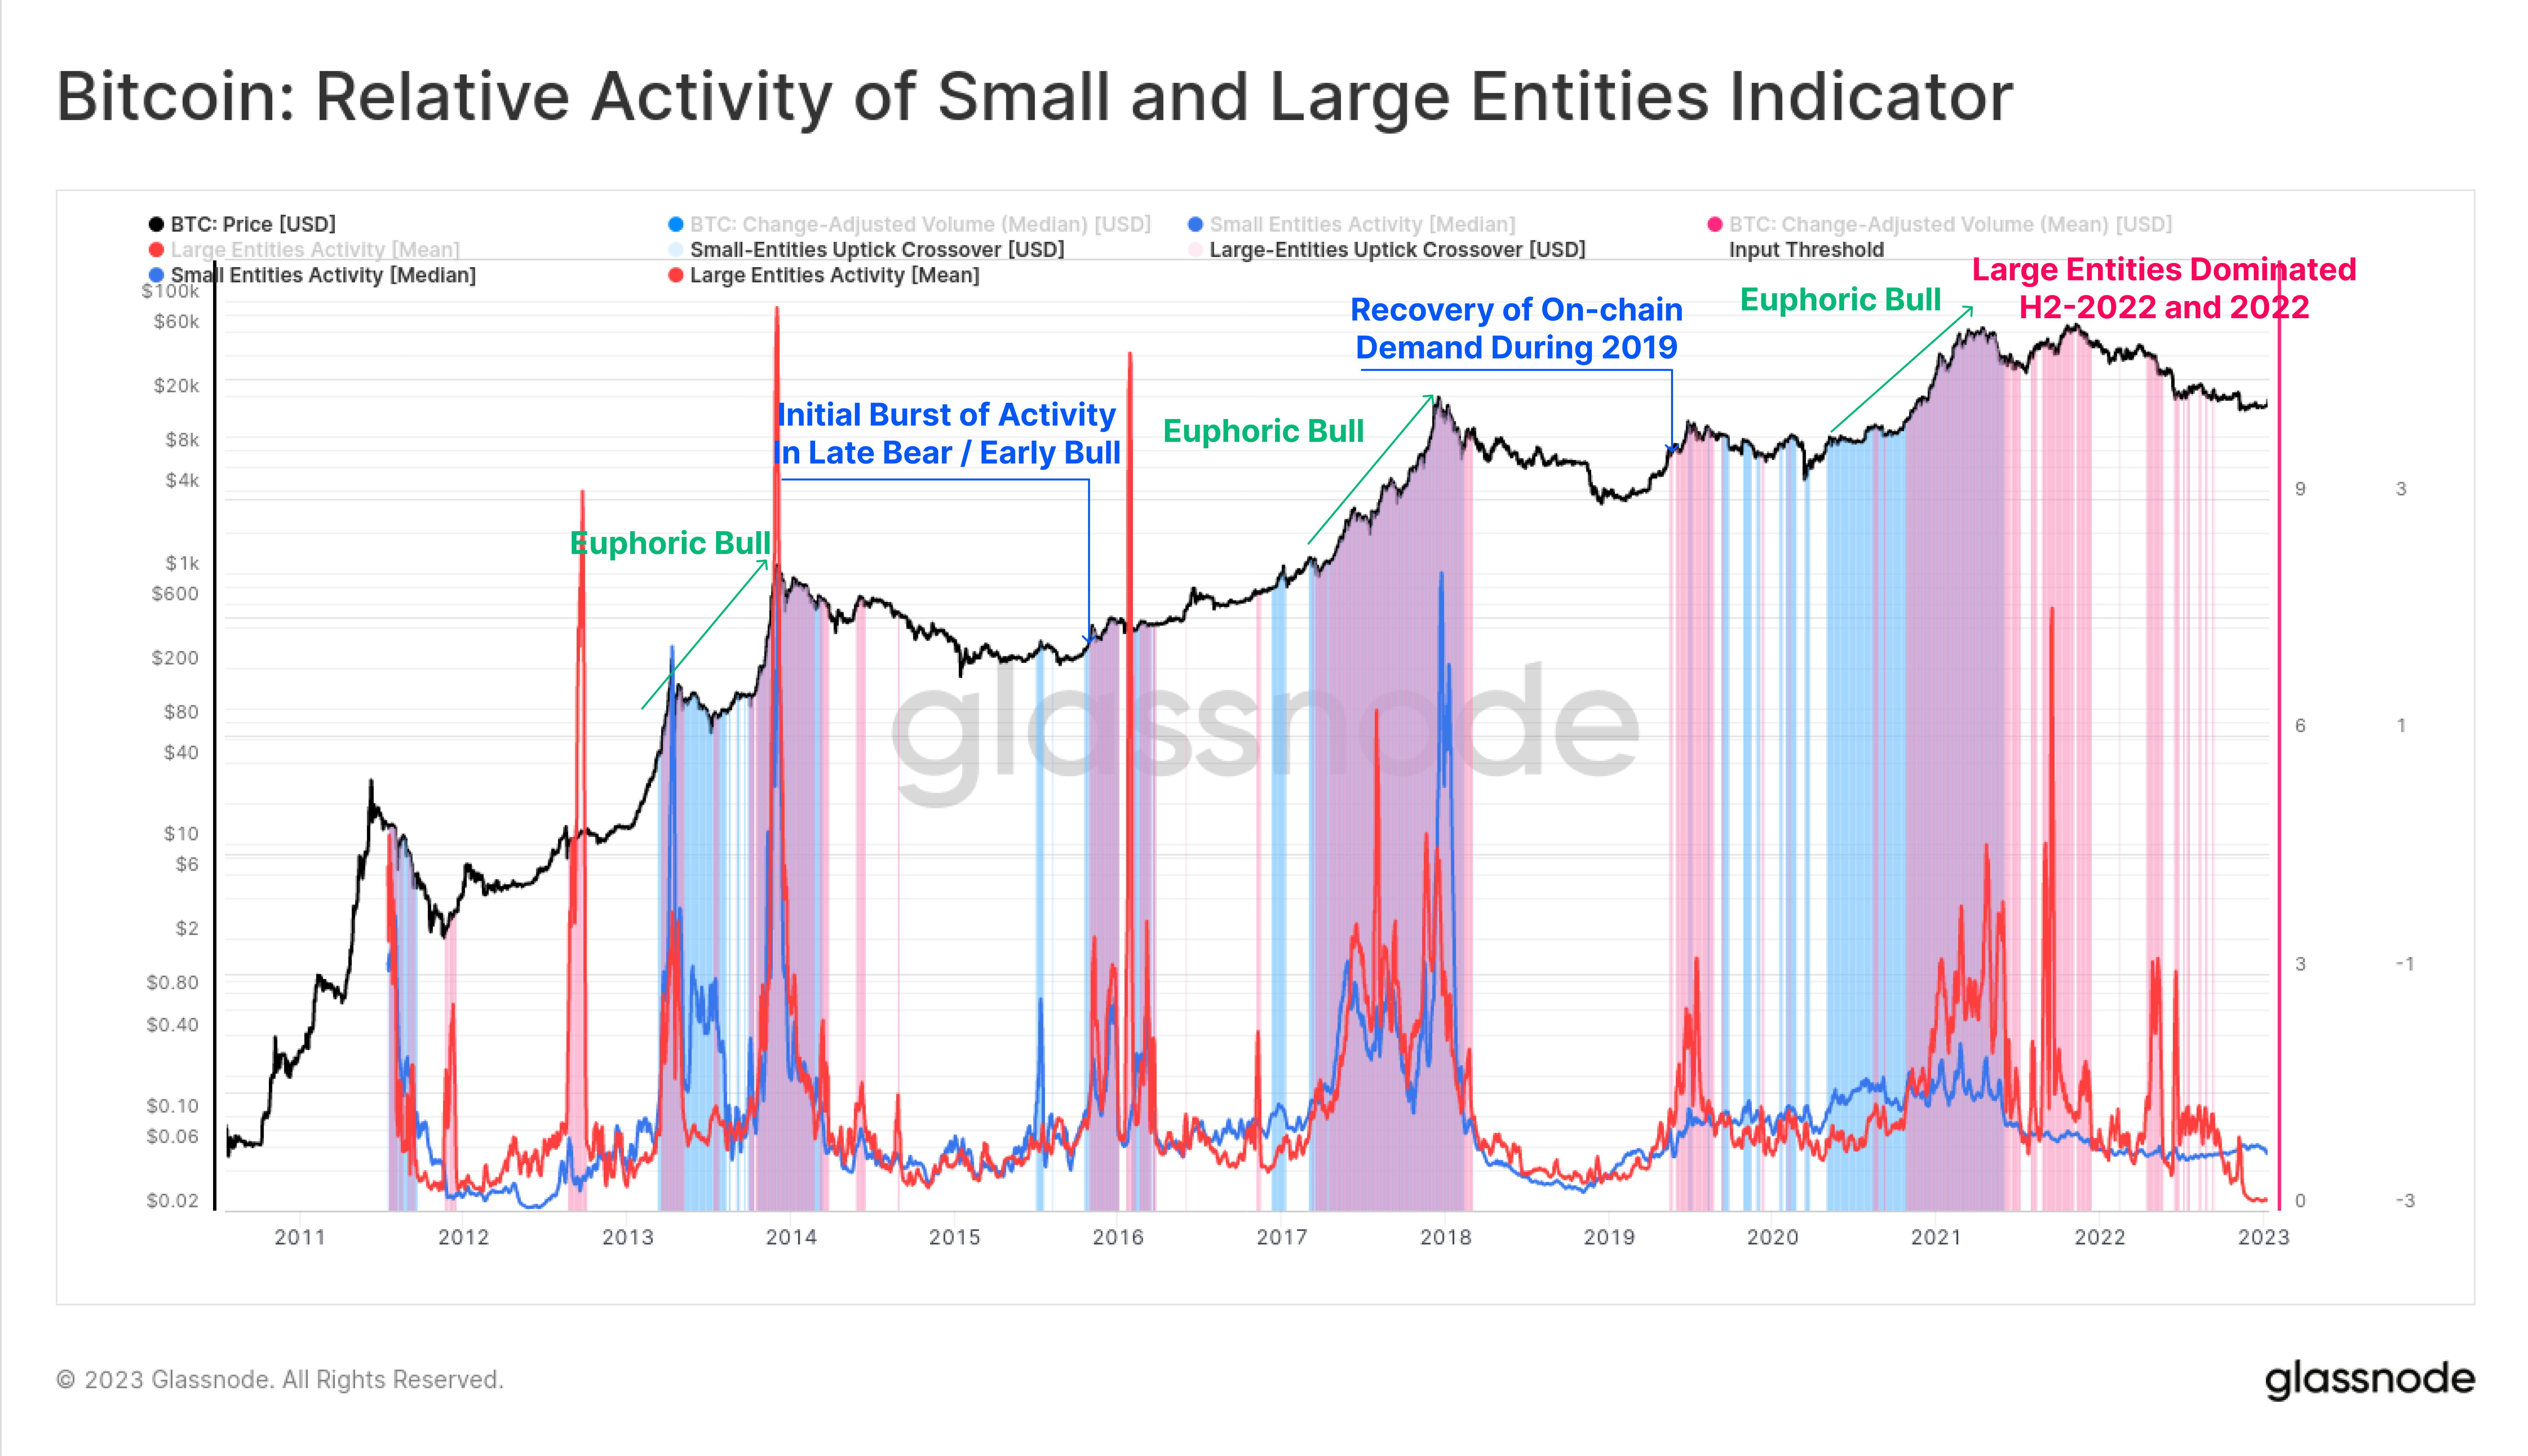
Against an imminent end of the bear market speaks the broader recovery of activity by smaller and larger entities. As usual for a bear market, the Relative Activity Of Large And Small Entities indicator still shows a significant decline in on-chain activity by entities of all sizes (threshold 1.2).

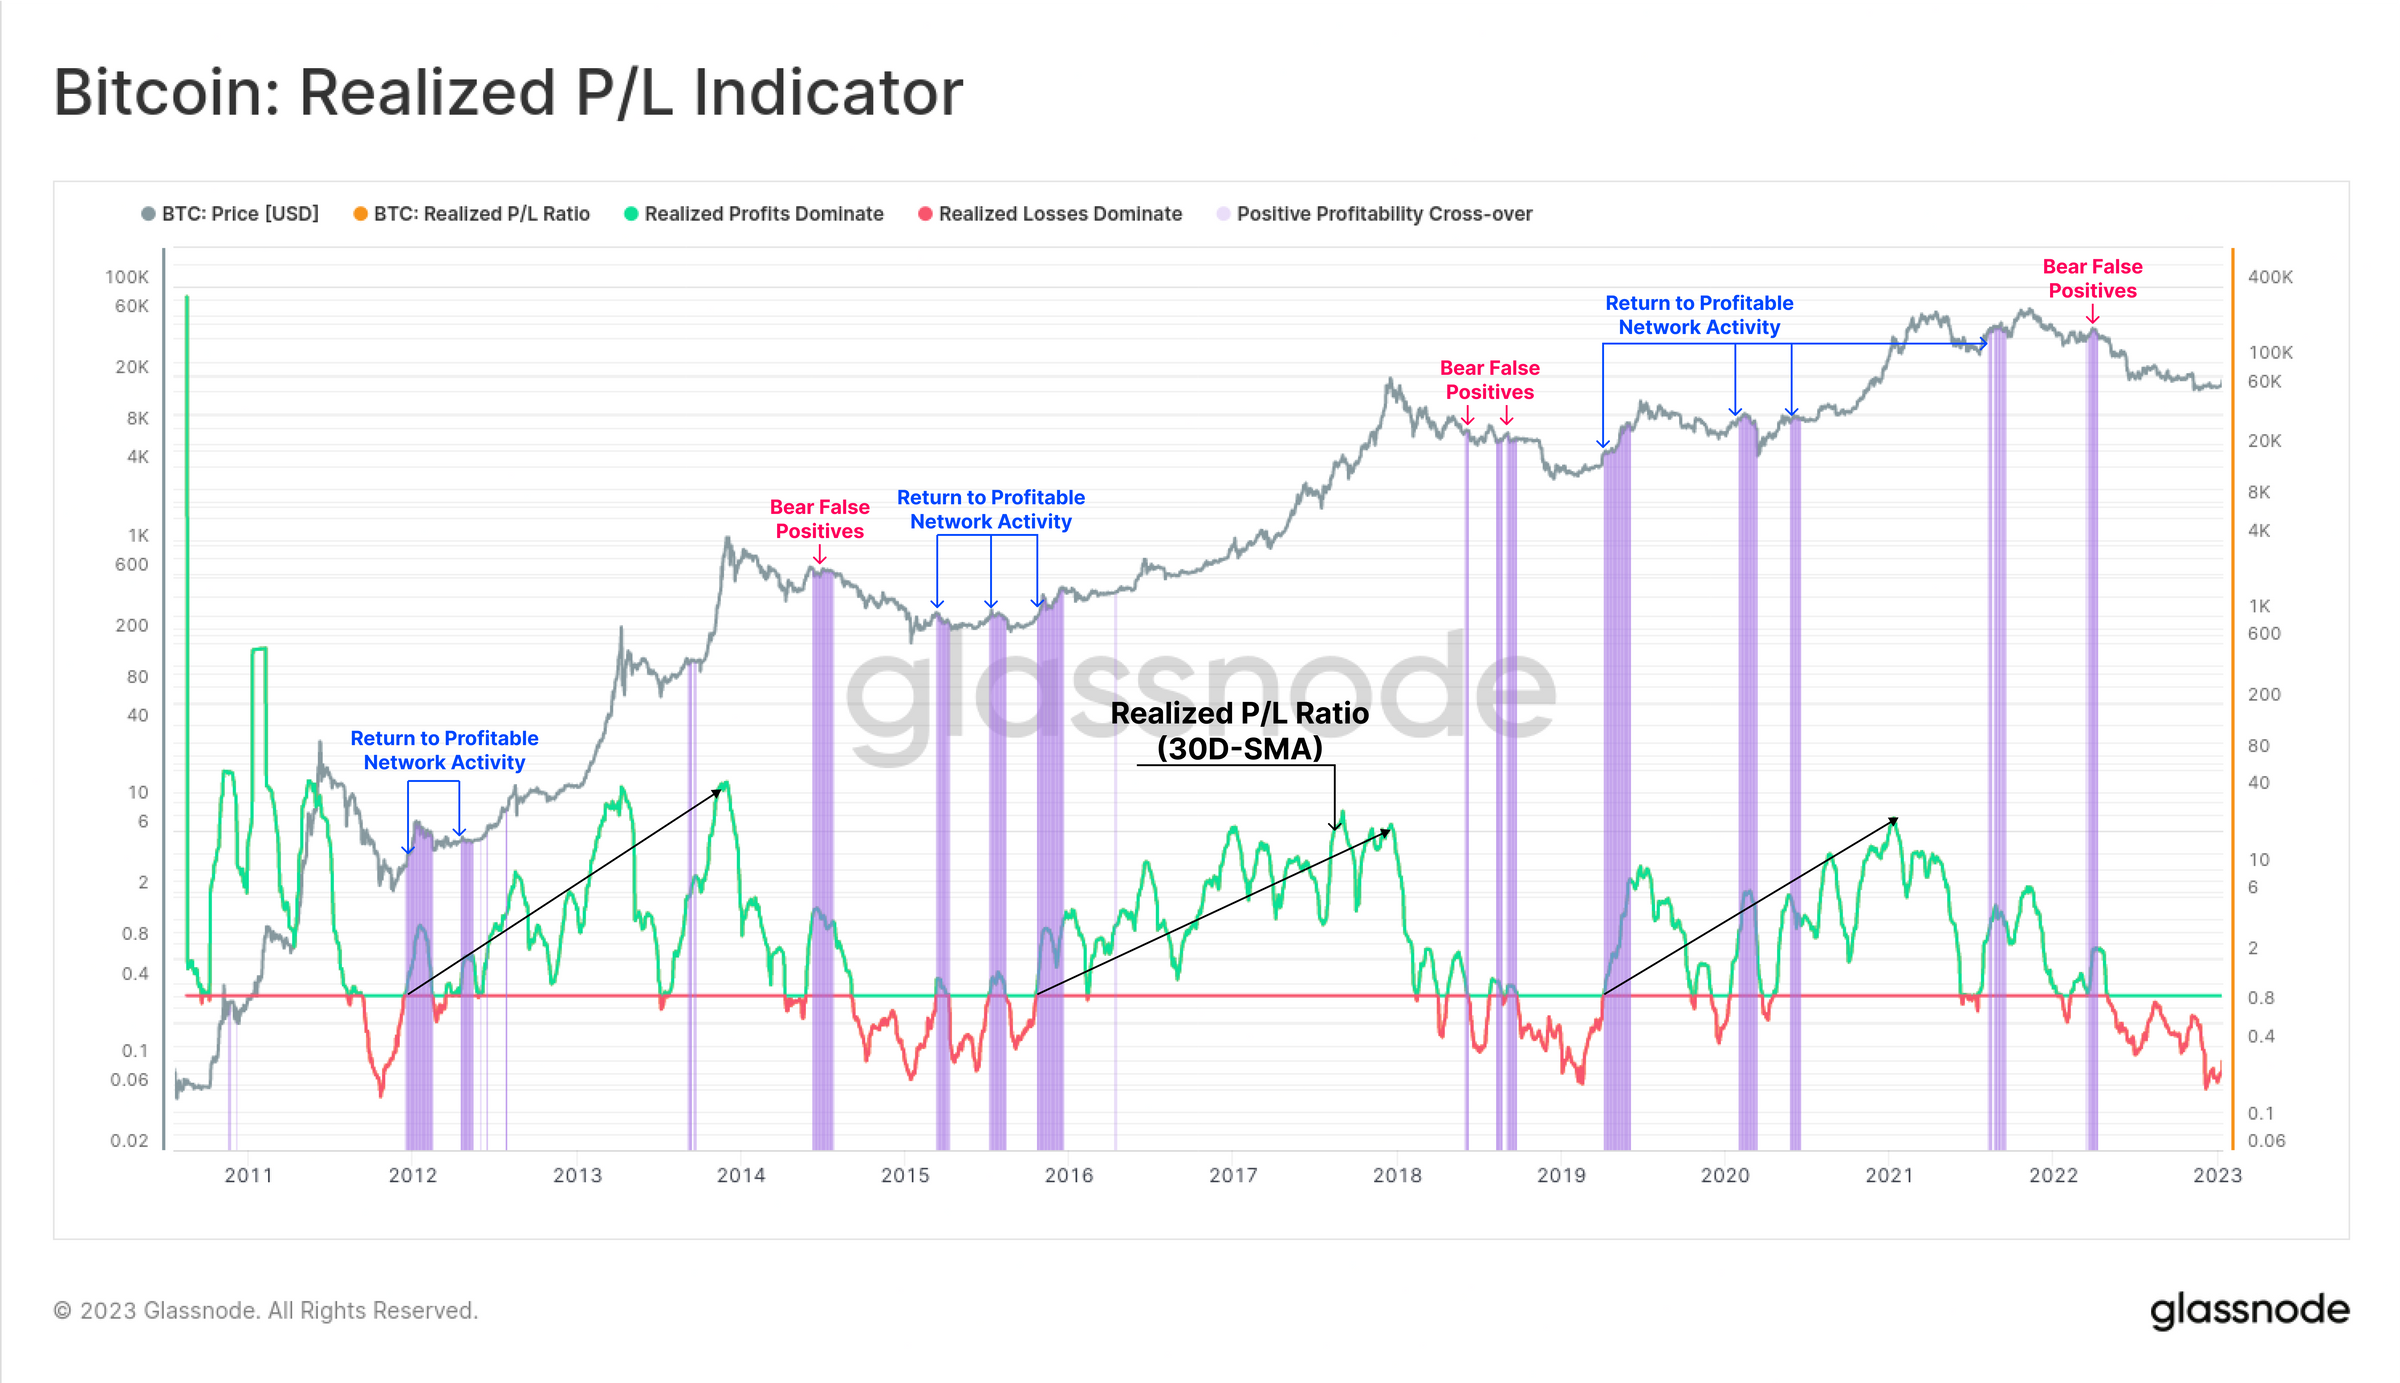
Also, the evaluation of the realized profit and loss shows the still bearish stage of the market. As the 30-day SMA of the realized P/L ratio has not yet recovered above 1.0, this suggests that demand is not yet able to absorb the profits taken.
A similar picture is painted by the aSOPR, which monitors profitability based on output spent and signals that there has been no trend shift yet.
Last but not least, according to Glassnode, confidence in a trend reversal on the chain has not yet been observed. This is reflected in spending patterns.
One way to measure this is to compare the amount of unrealized profit held within newly acquired (and HODLed) coins to that being realized by spent coins. The indicator has not yet been triggered but is close to a positive breakthrough.
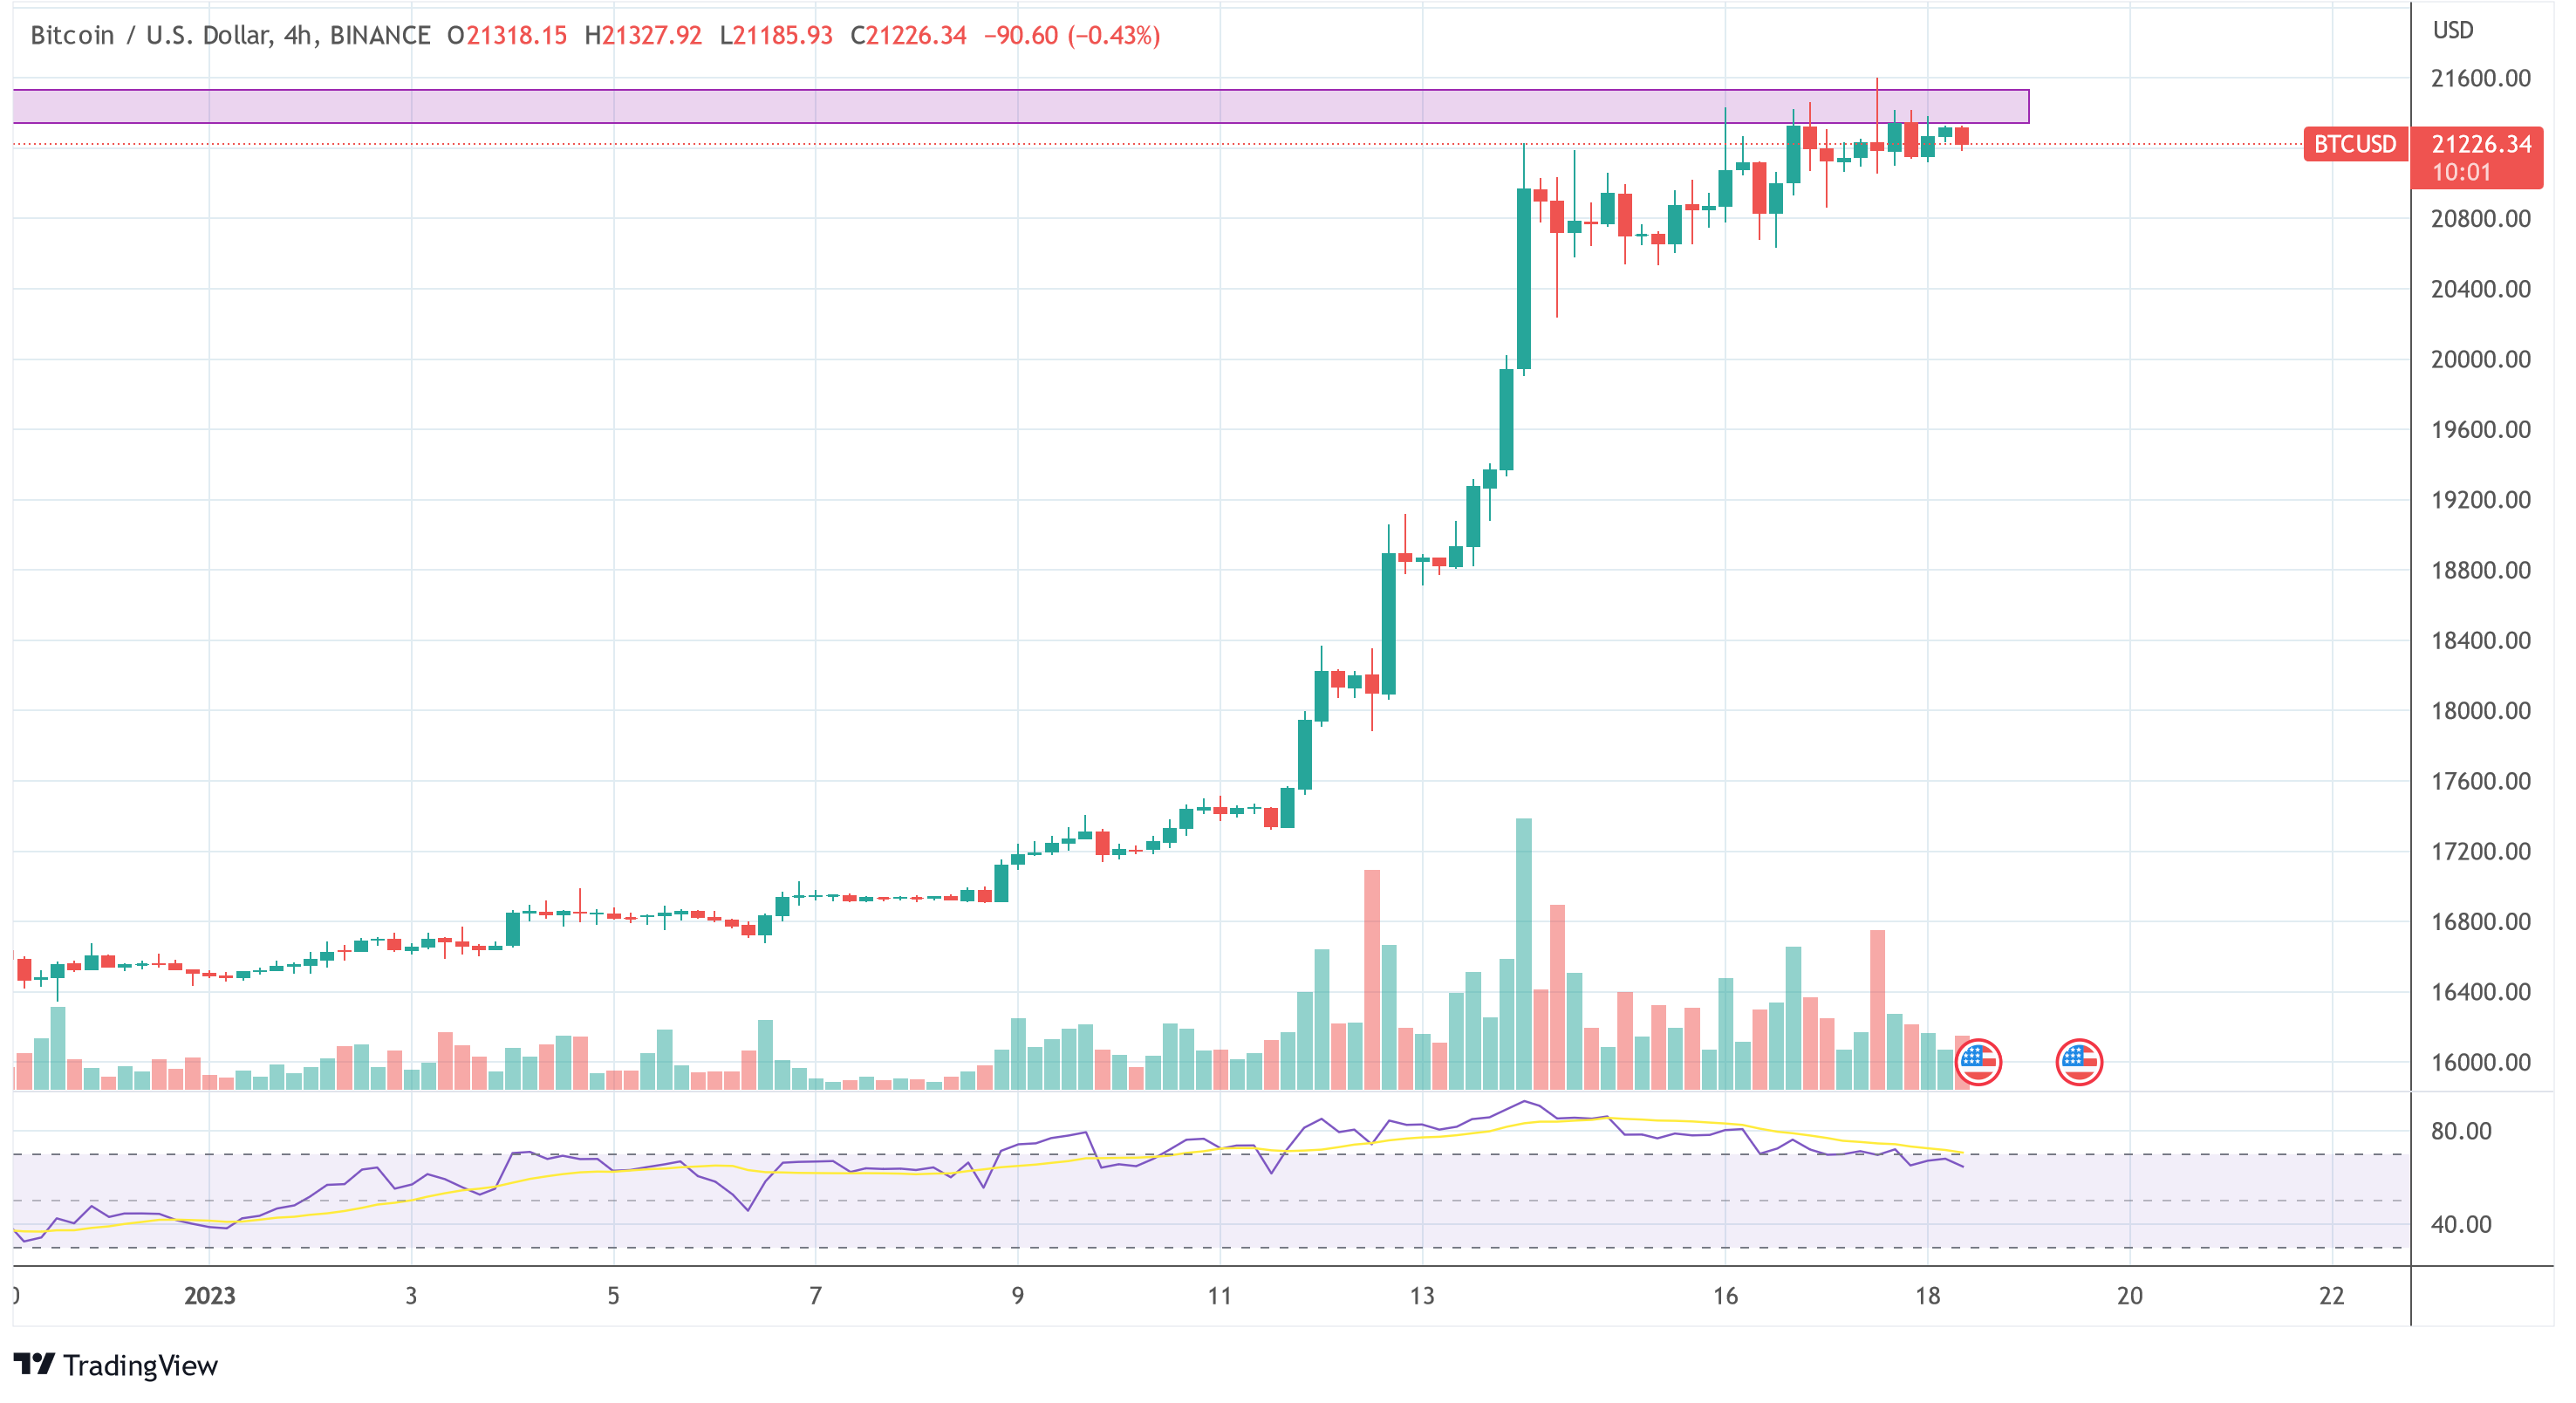
At press time, the BTC price traded just below the crucial resistance at $21,500.