
- Bitcoin has undergone an extremely strong rally since the March lows, rallying from $3,500 to $19,000 now.
- Analysts are hopeful that further growth is on the horizon.
- One top Bitcoin quantitative analyst “PlanB” recently said that BTC looks similar now to how it did in late 2016.
- As many remember, BTC rallied from around $800 at the start of 2017 to $20,000 by the end of the year.
Bitcoin Looks Similar to How It Did in Late 2016, Says Quant Analyst
Bitcoin has undergone an extremely strong rally since the March lows. The coin has moved from the $3,000s to $19,900 at the local high for a rally of nearly 500%.
Even still, analysts are hopeful that further growth is on the horizon for the flagship cryptocurrency. One top Bitcoin quantitative analyst “PlanB” recently noted that Bitcoin’s price action in relation to its 200-weekly moving average (simple MA) looks similar to how it did in late 2016 or early 2017:
“Bitcoin 200WMA $7500 (monthly increase 5.5%), looks like late 2016 / early 2017.”
As many remember, BTC rallied from around $800 at the start of 2017 to $20,000 by the end of the year. BTC looking structurally similar now may suggest that a similar or comparable spurt of growth is on the horizon.
Another chart the analyst shared recently also shows that Bitcoin’s relative strength index (RSI) looks extremely similar to where it was at the start of the parabolic phase of the last cycle.

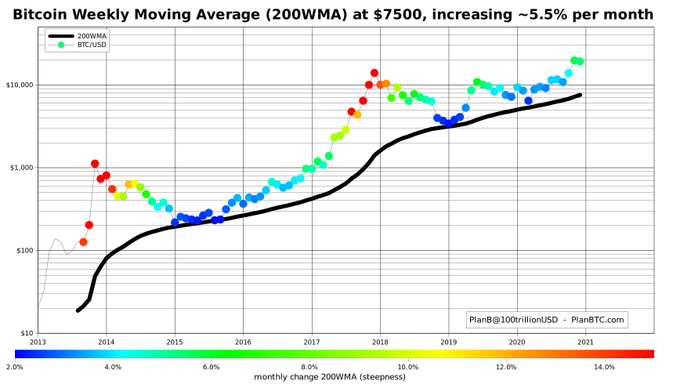
Chart of BTC's price action since 2013 with a moving average analysis by crypto trader PlanB (@100trillionUSD on Twitter).
Source: crypto trader PlanB (@100trillionUSD on Twitter)
Bitcoin is also at a similar point to 2017 from a cyclical perspective, namely in that the halving before last took place in mid-2016 and the last halving took place in mid-2020. The cyclicality of Bitcoin suggests that it will soon begin a similar rally.
The Stock to Flow Price Model
Core to PlanB’s bullish sentiment is the stock to flow price model, which basically suggests that BTC’s price action is related to its inverse inflation rate. The scarcer the BTC, the higher the price, the model suggests.
His original model predicts that Bitcoin’s market capitalization will hit $1 trillion, or $55,000 per coin, in 2021:
“People ask me where all the money needed for $1trn bitcoin market value would come from? My answer: silver, gold, countries with negative interest rate (Europe, Japan, US soon), countries with predatory governments (Venezuela, China, Iran, Turkey etc), billionaires and millionaires hedging against quantitative easing (QE), and institutional investors discovering the best performing asset of last 10 yrs.”
An updated model of his estimates a $100,000 price by the end of 2021, just 12 months away.
Some have pushed back against the model, though many do agree that an increase in demand meeting a decreasing supply should result in higher prices over time.
Featured Image from Shutterstock
Price tags: xbtusd, btcusd, btcusdt
Charts from TradingView.com
Macro Analysis Predicts Bitcoin Has Begun Rally Toward $100k