

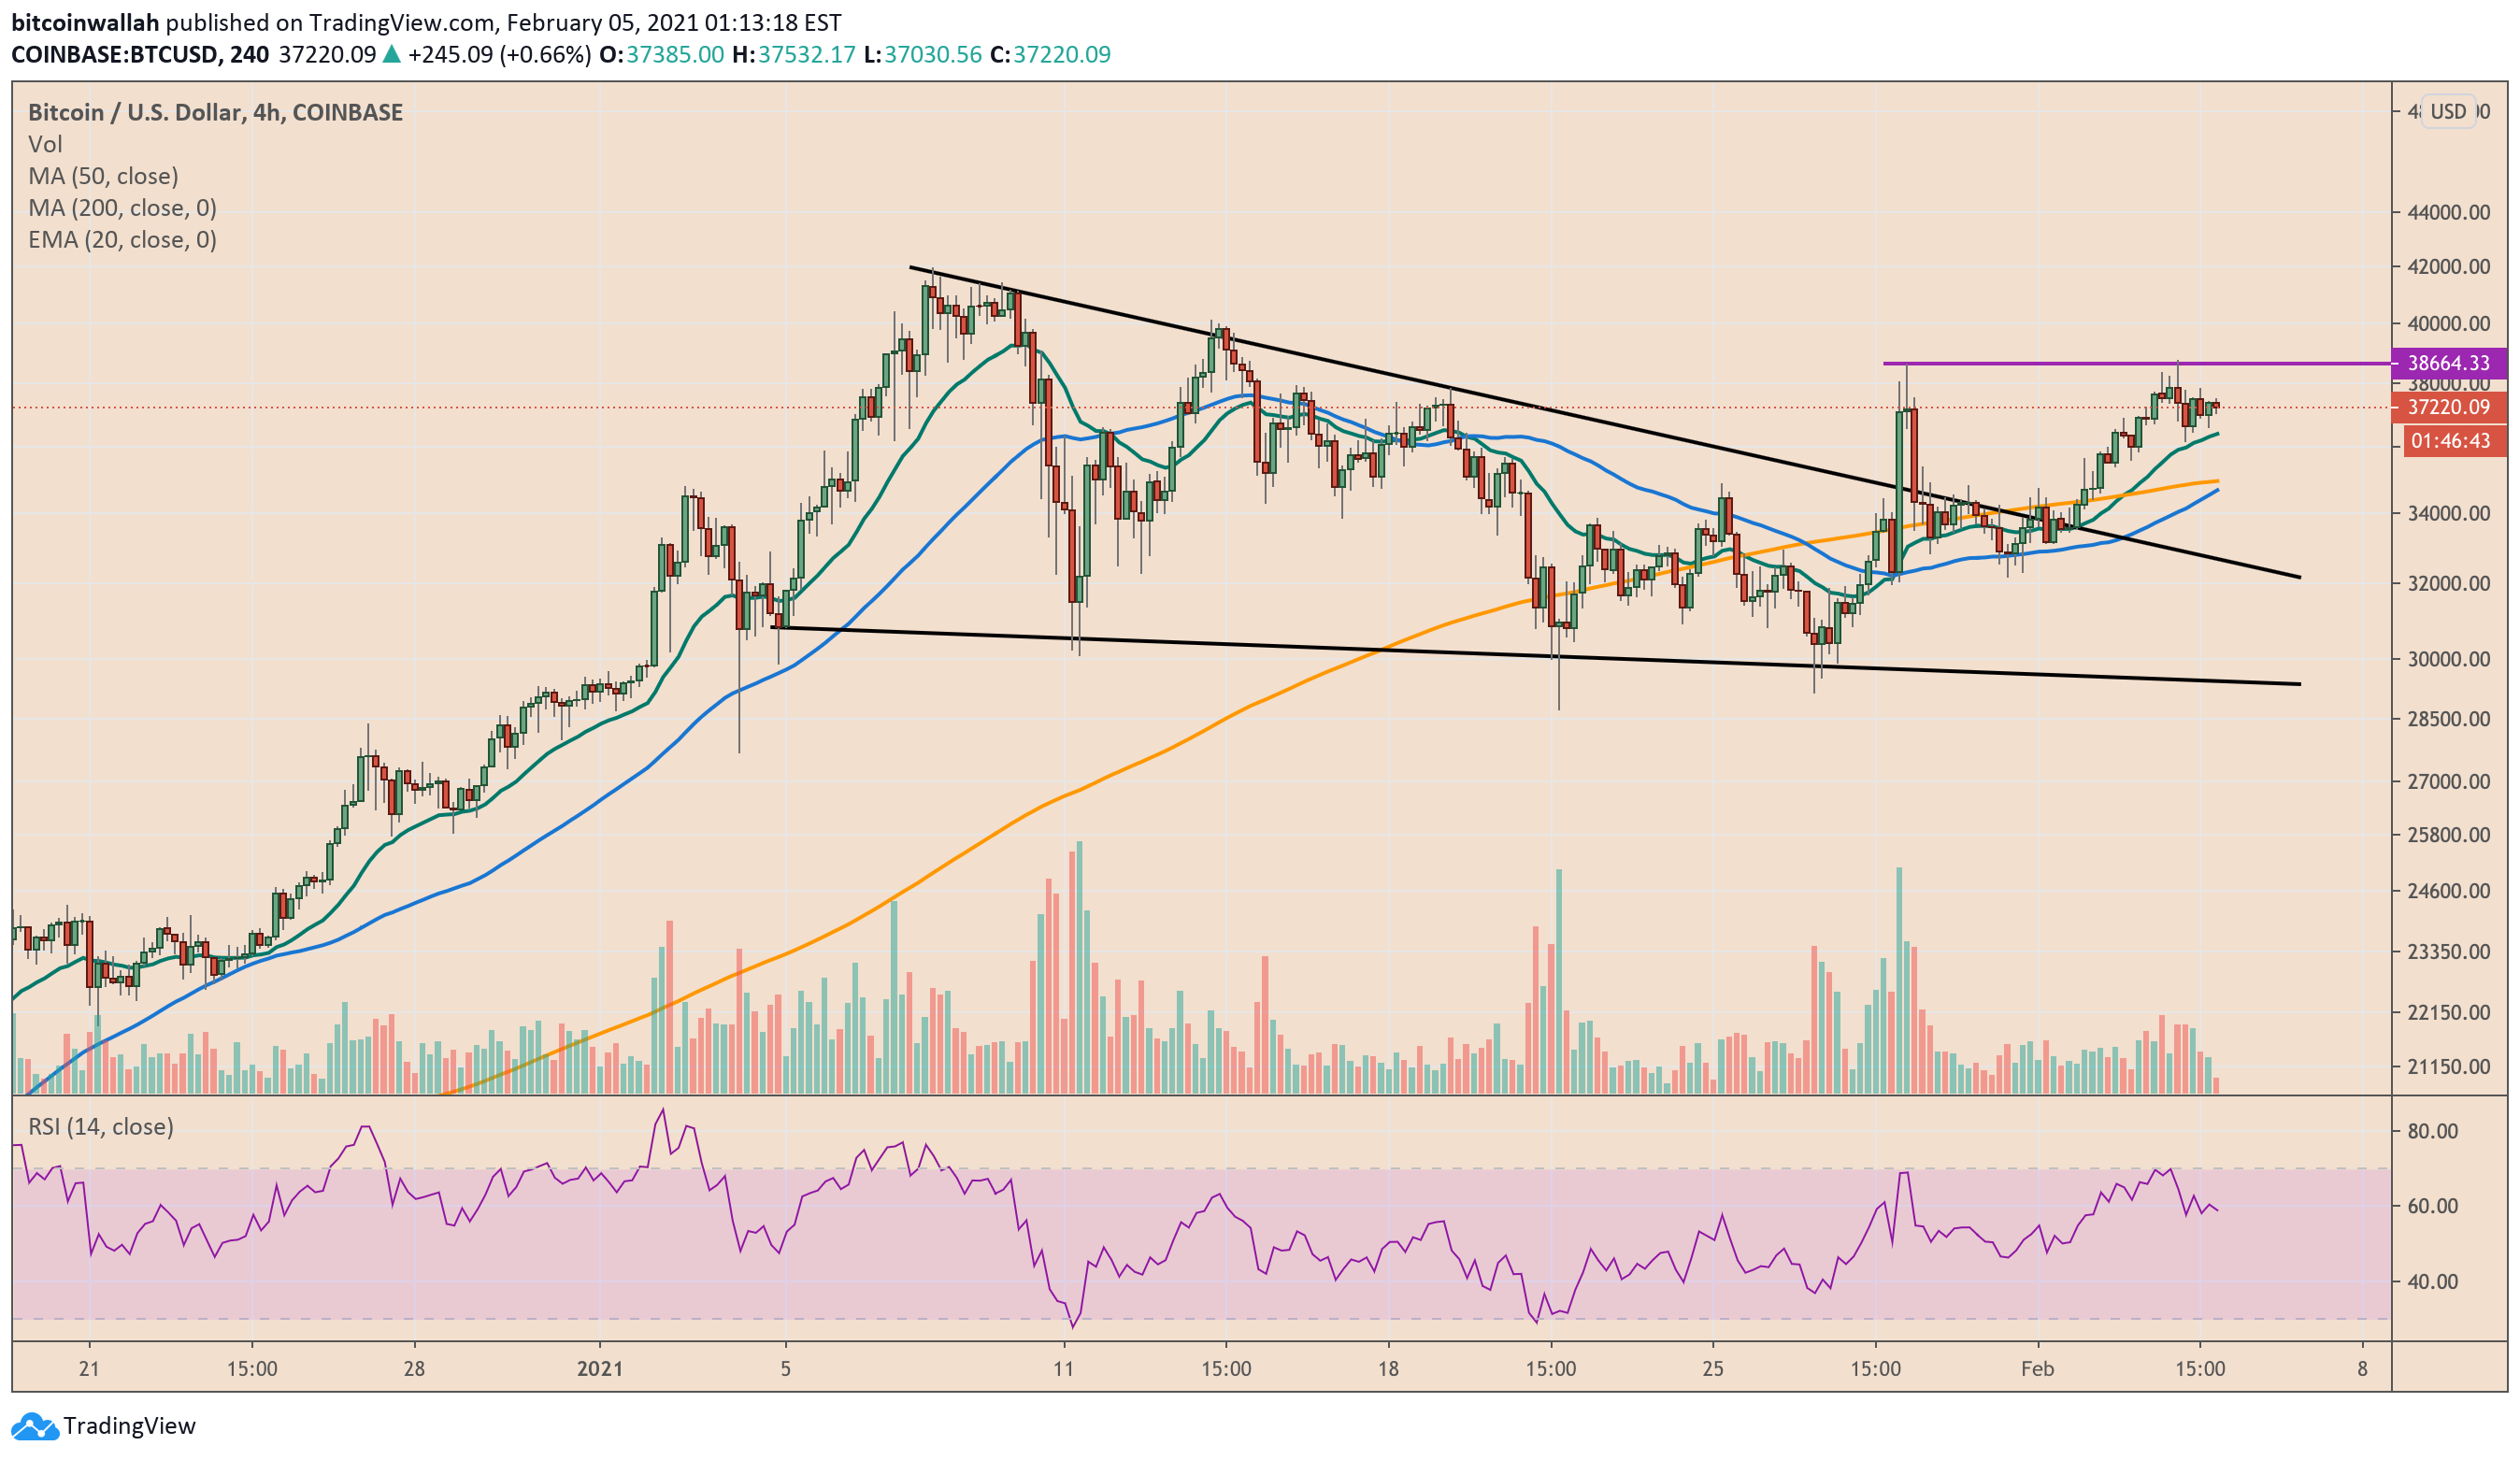
Bitcoin is looking at an imminent crossover between its short-term and long-term moving averages, a phenomenon that many professional traders consider as a cue for future price rallies.
Dubbed as the “Golden Cross,” the convergence is a positive momentum indicator, occurring when an asset’s 50-period moving average moves above its 200-period moving average. It comes in three stages. The first one requires that a prevailing downtrend bottoms out as selling sentiment depletes.
In the second stage, the 50-period MA jumps above the 200-period MA for a breakout confirmation. Meanwhile, the last stage sees a continuation in an uptrend to higher price levels. Based on what Bitcoin prices have displayed in the last two weeks, the cryptocurrency looks to be jumping from stage one to stage two.
Bitcoin Bottoming Out?
The BTC/USD exchange rate showed signs of bottoming out inside the $27,500-$31,000 range, having capped multiple steeper sell-off attempts by bears in recent history. On-chain analysts note that the $30,000ish levels attracted many institutional investors to the market, making it less likely for BTC/USD to drop anywhere below the said price floor.
Further proofs came from MicroStrategy, a Nasdaq-listed software firm with one of the largest Bitcoin reserves. It announced on Wednesday that it bought $10 million worth of BTC “at an average price of $33,810.” Meanwhile, New York-based investment firm Grayscale also upped its Bitcoin accumulation in the third week of January when its price was trading in the $32,000-36,000 range.
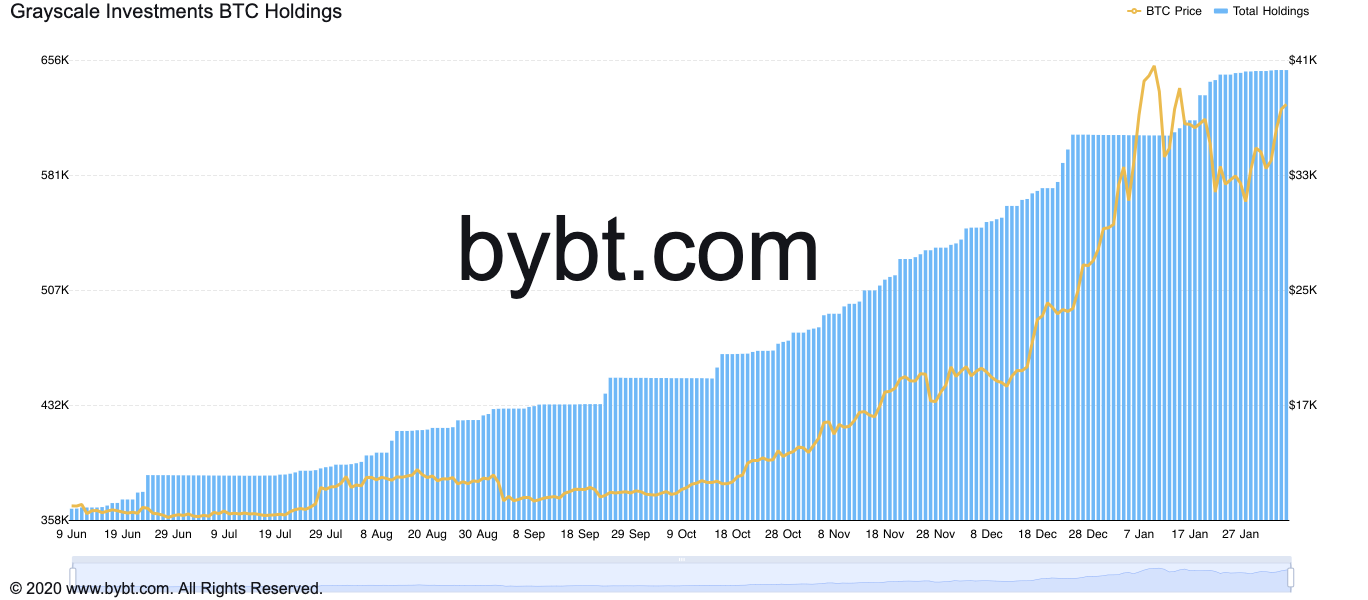
That somewhat marks the first Golden Cross stage as Bitcoin forms a local bottom around $30,000.
Imminent Crossover and a Breakout
The next stage is the 50-200 MA crossover itself. Nonetheless, based on Bitcoin’s previous stint with golden crosses, the phenomenon does not guarantee an immediate uptrend.
Last October, the cryptocurrency slipped by more than 5 percent to $10,350 just when it confirmed a golden cross. But the bulls took charge and sent the prices up by as much as 297 percent in the next months, to a record high near $42,000. Similarly, in late July, BTC/USD experienced mild corrections towards 20-period MA after logging a 50-200 MA crossover.
In some cases, Bitcoin also entered lengthy consolidation periods. Nevertheless, the cryptocurrency always came out more bullish than the last time.
That somewhat puts BTC/USD at a privilege to test higher levels in the coming sessions, especially as it attempts to reclaim and break above its previous record high of $41,986.