

Guess who just got back today? That wild eyed bull that had been away, has reappeared as Bitcoin price just broke $7,700! Question is, will the bears go quietly or will BTC continue trading sideways as they maul it into submission?
Market Overview
It’s in tumultuous times such as these that investors should just kick back and relax. Take a deep breath, read a book, binge watch Netflix or just listen to Thin Lizzy as we at Bitcoinist love to do…hence the not so subtle mash up of the Thin Lizzy’s chorus in the title.
Bitcoin had been doing so well, climbing past $7,500 USD late last week and the move toward $7,700 was especially pleasant. For a moment, it almost appeared that McAfee’s prediction was coming true before our eyes, then with one fell swoop bitcoin price collapsed and it looks like we’re going back under $7,500 again.
Anyhow, let’s get to it and see what’s happening with bitcoin.
Daily Chart
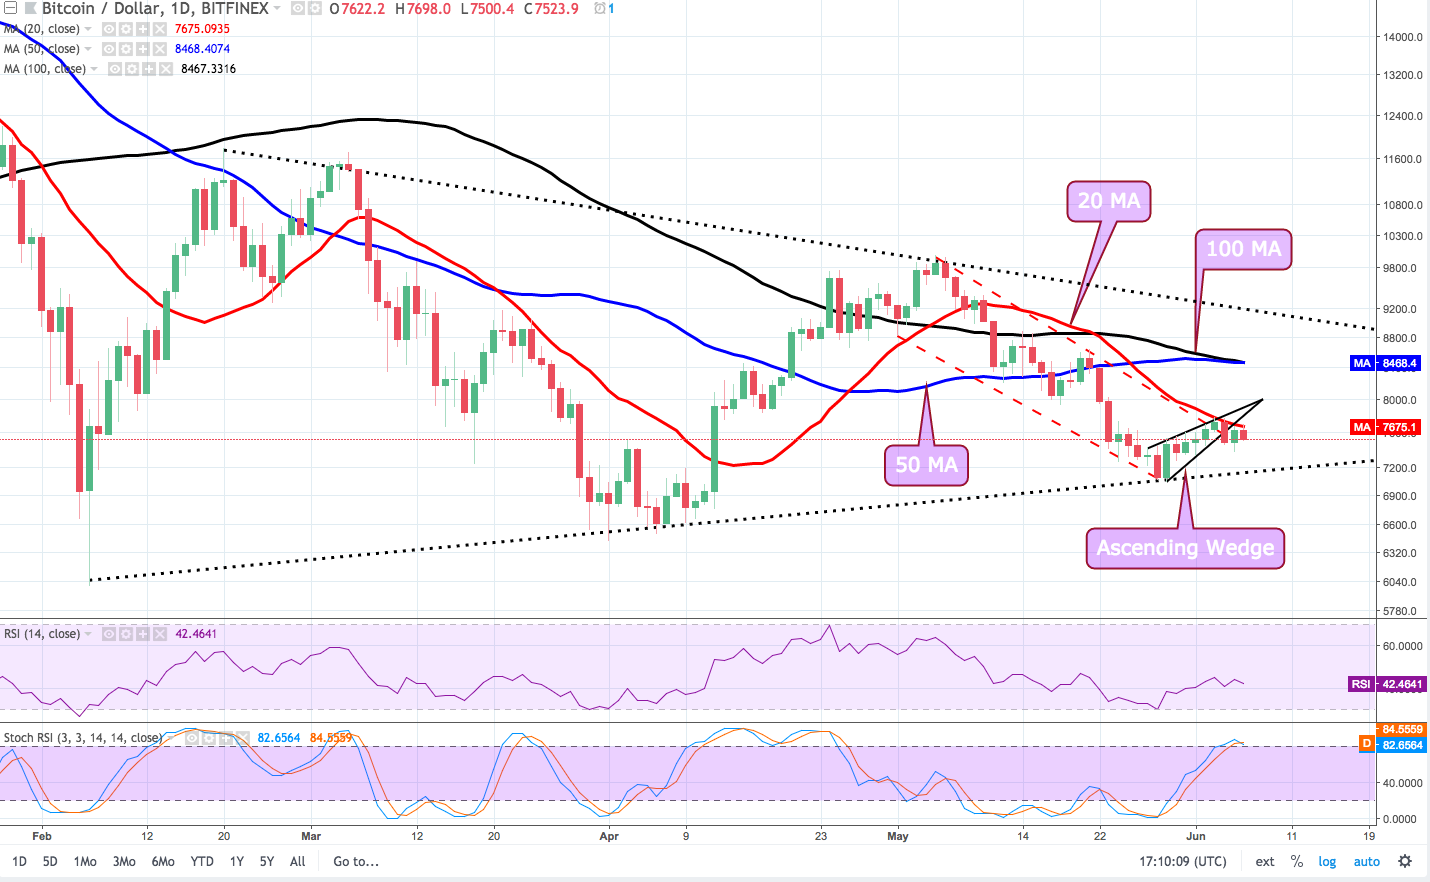
On June 4th, BTC dropped from the ascending wedge, signaling a bullish-to-bearish trend change as the cryptocurrency failed to find footing above $7,500 and $7,650.
Following the rising wedge breakdown, BTC nearly closed below $7,500 and the downtrend that started on May 5th continues as bears have mauled BTC back into the descending channel.
At the time of writing, BTC trades below the ascending wedge trendline, inside of the descending channel and a quick glance at the moving averages shows the 20-day MA well below the 50 and 100-day MA. The 100-day MA slopes downward, touching the 50-day MA at $8,482, which is a sign of bearish pressure.
A glance at the the 1 hour chart (not pictured here) shows the 5 and 10-day MA crossed in steep descent and the RSI has fallen from 58 to 44 without any signs of a turn around. The Stoch also resides in overbought territory and appears to be reversing direction as the signal lines have crossed and begun to descend.
The general outlook portrays bears as having the advantage and a BTC close below $7,500 is likely to bring on further decline in BTC price.
4HR Chart
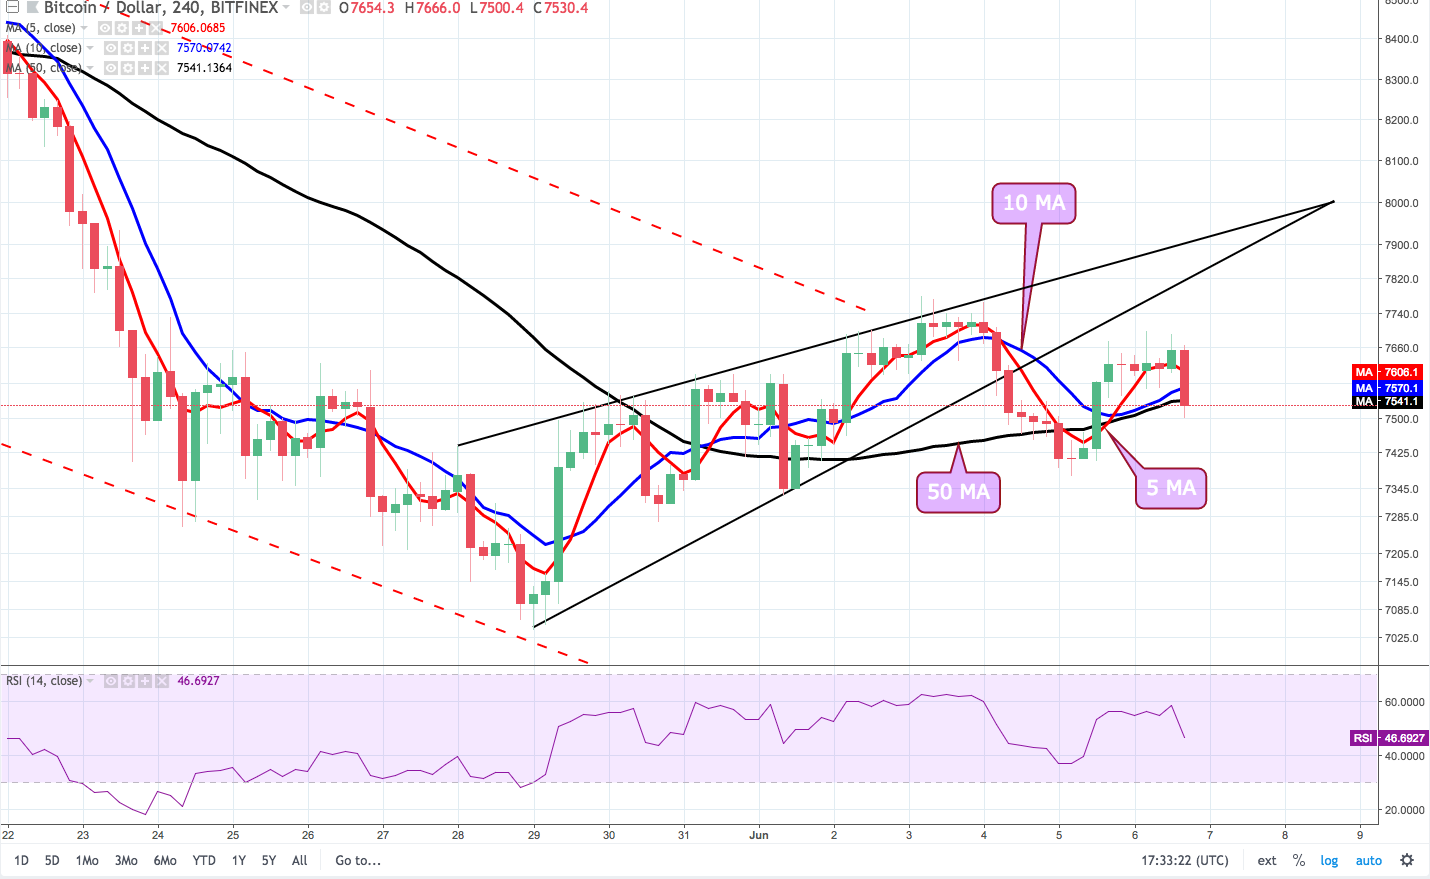
Generally, the 4 hour chart is quite similar to the daily chart, except for the 5-day MA ever so slightly above the 10 and 50-Day MA, though at the time of writing the 5-day MA has also rounded down and is hiding behind that big red candle.
The 10-day MA is beginning to put some distance between itself and the 50-day MA by inching its way up toward the 5-day MA; and while this does not appear to be a period of consolidation, the slope upwards in combination with a series of doji candlesticks at least shows the presence of some bullish pressure as BTC struggles to overtake $7,600.
Bitcoin Price: Looking Ahead
BTC will need to reach $7,850 in order for bulls to regain control.
A close below the 50-day MA ($7,530) could see BTC drop to the nearest support at $7,365 and the absence of buyers could see the price drop as low as $7,200 – $7,000 again.
As suggested last week, if bears manage to retake control, BTC could re-enter the ascending wedge at $7,800 and in the event of high volume buying BTC could rise as high as the 50-day MA at $8,450 (daily chart). Traders should keep an eye on volume in order to gain insight on the strength of any upward movement.
In the meantime, it’s safe to assume that the majority of buyers are waiting patiently on the sidelines and since it’s good to always try and end things on a high note, we’ll leave you with this…
The 12th of June is a mere 5 days away and in the event of a miscast prediction, the cryptocurrency community can at least look forward to McAfee’s 2020 run for POTUS.
[Disclaimer: The views expressed in this article are not intended as investment advice. Market data is provided by BITFINEX. The charts for analysis are provided by TradingView.]
Where do you think Bitcoin price will go this week? Let us know in the comments below!
Images courtesy of ShutterStock, Tradingview.com