

Bitcoin price is running but she’s not out of the woods yet. Technical charts show a pack of angry bears right at the heel, but at last, in swoops a hero!
Is it volume?
No.
Is it the cavalry composed of fat cat institutional investors and bitcoin beluga whales?
Nope.
At the edge of the tree-line, waiting with hands extended…or actually, tapping to the rescue via Twitter is the one and only person who can restore Bitcoin to its rightful place above 10k.
John McAfee?


McAfee recently reaffirmed his belief that bitcoin will trade above $15,000 by June 12th and voila, BTC price popped right up to $7,600 yesterday. At this point, one cannot draw a direct connection between the words of a notorious coin shill and changes in bitcoin price, but it can’t be disputed that McAfee’s statements had an effect on the prices of multiple cryptocurrencies in the past.
Market Overview
For the moment, the valor of McAfee’s chivalrous shill appeal appear to have had little impact as Bitcoin’s technical setup remains relatively unchanged. But technical charts are beginning to show a budding attempt of a reversal.
News-wise, this week hasn’t provided any market moving events but there were a few intriguing posts from Twitter technical analysts.
Twitter user FilbFilb, for example, argues that the Money Flow Indicator serves as a reliable oscillator for measuring buying and selling pressure and his or her charts demonstrate how it could be used to forecast BTC movement.
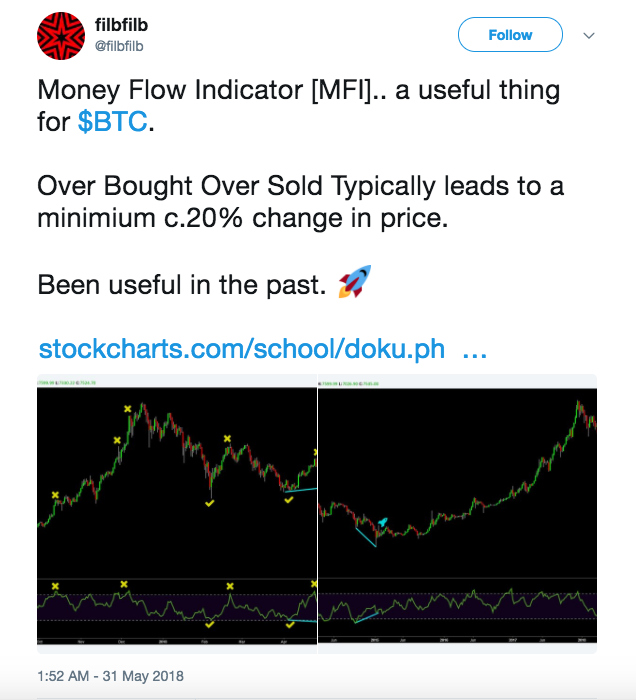
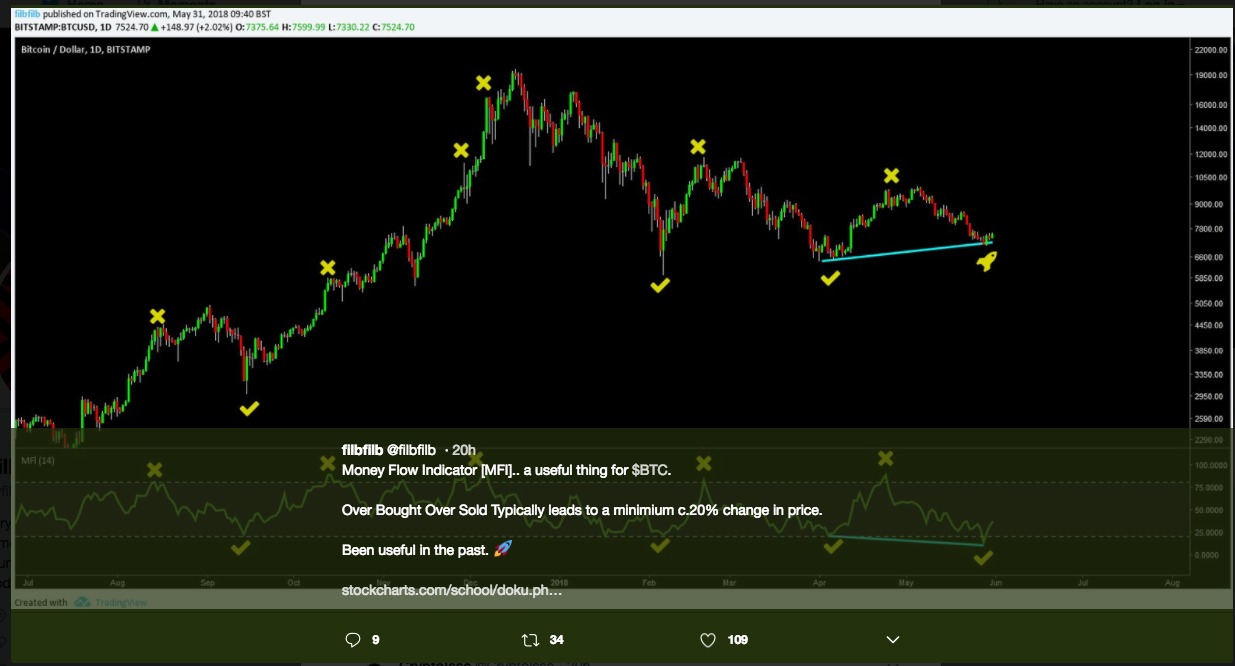
Meanwhile, Roger Quantrillo posted his mic drop BTC triangle chart which provides plenty of food for thought.

Now, those are beautiful charts that provoke all sorts of bearish and bullish thoughts but it should be noted that cryptocurrency price movement (especially Bitcoin) does not happen in a vacuum.
So, reliance on one oscillator, or any combination of technical analysis tools has yet to be proven as being capable of providing reliable data for BTC price direction and the same observation applies to the charts below.
Daily Chart
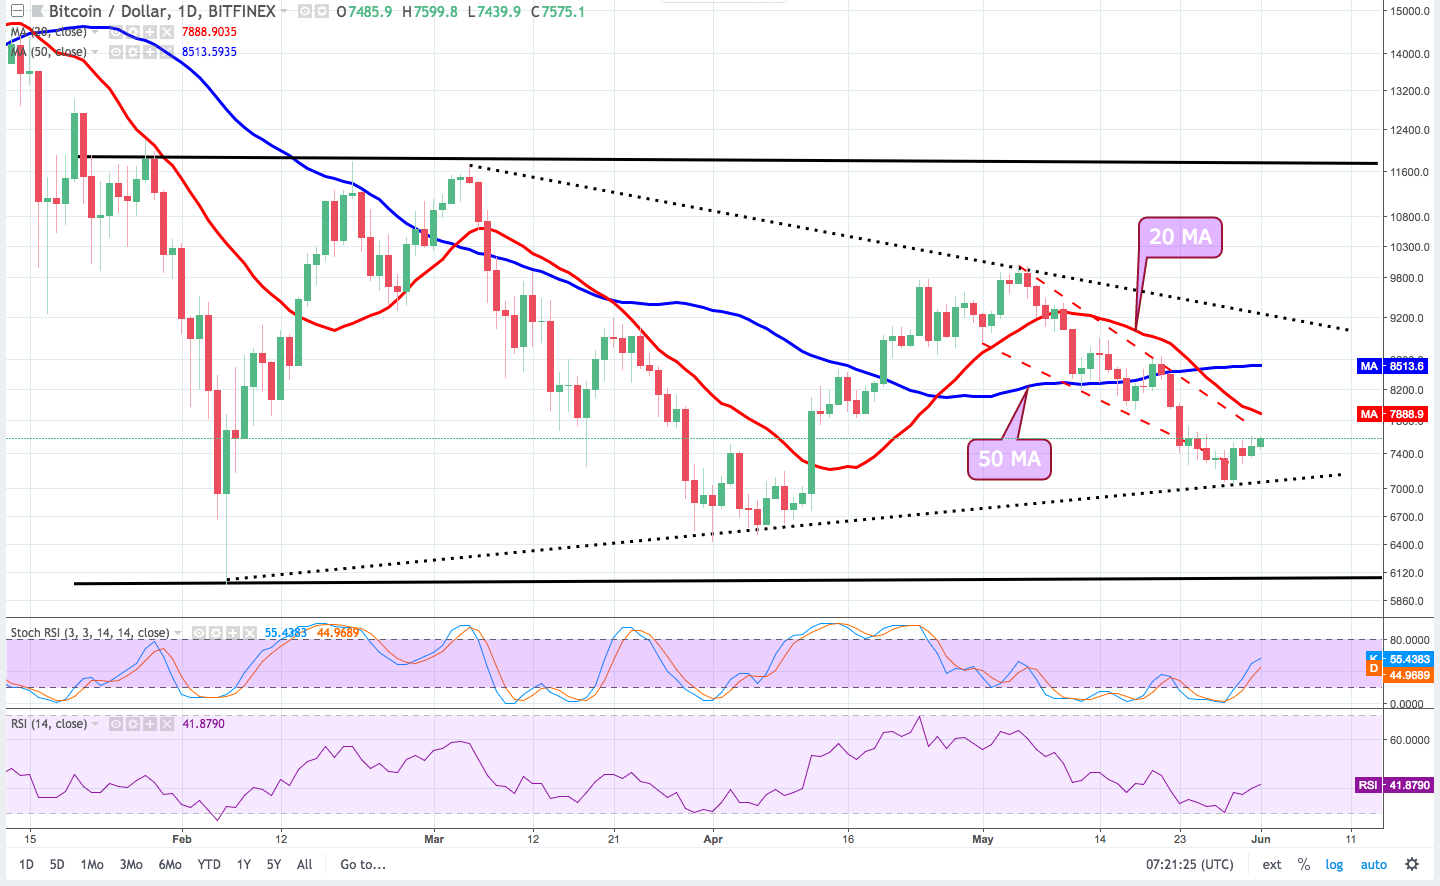
At the time of writing, BTC continues to trade near the bottom leg of the descending channel and a quick glance at the moving averages shows the 20-day MA continuing to plummet well below the 50-day MA.
Since dropping to $7,043 on May 29th, BTC has been pinned between $7,200 – $7,600 and is slowing working its way towards the next levels of resistance at $7,650 and $7,870 (20-day MA).
Encouragingly, there appears to be an inverse head and shoulders formation developing, but to confirm this, BTC needs to meet the neckline slightly above $7,600.
Both the RSI and Stoch are angled upward and heading into bullish territory as BTC approaches $7,600, which supports the case for BTC extending to $7,850 in the near term.
4HR Chart
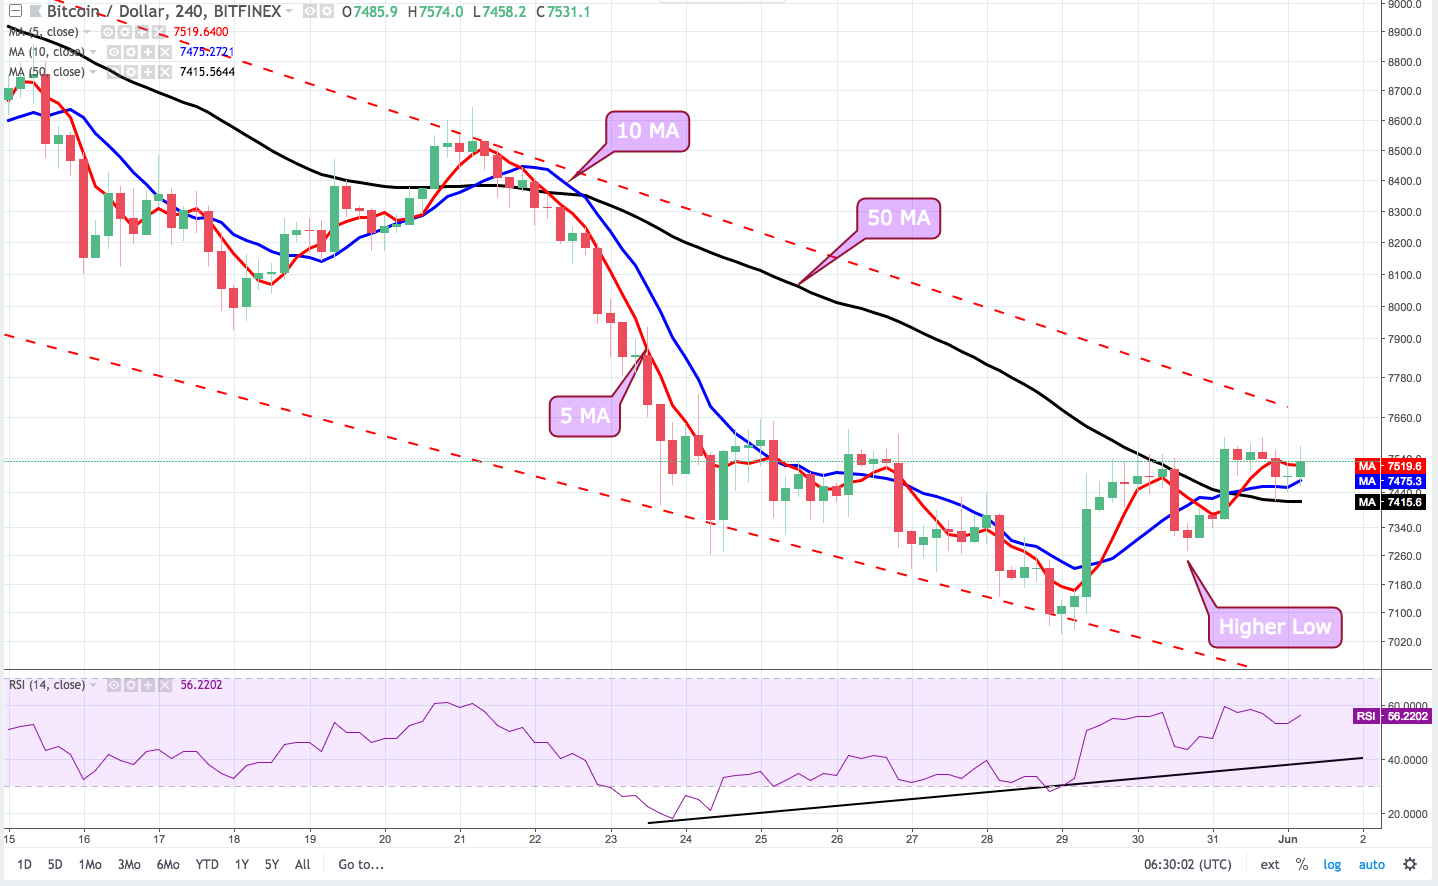
The 4 hour chart paints a more positive picture with the 5 and 10-day MA crossed, moving upward, and above the 50-MA. The 50,100 and 200-MA continue to slope downward in favor of bears so traders should keep an eye on volume as the pop could be short lived in the event of a gains above $7,850.
On May 31st, BTC posted an outside-day candle, which is a bullish indicator as the higher low hints at a price reversal. The possibility of a reversal is further supported by the bullish divergence seen on the RSI oscillator.
Combined, all of these factors, along with the nearing completion of an inverse head and shoulders formation, make a strong case for the possibility of a bullish reversal.
Bitcoin Price: Looking Ahead
BTC appears to be wrapping up a period of consolidation and gearing up for a breakout.
In the short-term, a test of the descending channel trendline near $7,850 is probable and traders should keep an eye on volume in order to gain insight on the strength of the movement. If there is strong buying pressure BTC could run up to $8,520 (50-day MA on the daily chart).
Failure to break and stay above the $7,650 resistance could see BTC pullback to a soft support level at $7,100, followed by stronger support at $6,750. Hence, it is recommended to keep an eye on volume and the position of the Stoch and RSI in the event of a reversal.
[Disclaimer: The views expressed in this article are not intended as investment advice. Market data is provided by BITFINEX. The charts for analysis are provided by TradingView.]
Where do you think Bitcoin price will go this week? Let us know in the comments below!
Images courtesy of ShutterStock, Tradingview.com