

How do rumors of institutional investment and the return of mainstream media cryptocurrency hype impact Bitcoin price projections?
Highlights
At last! The days we’ve all been waiting for are back, or so it appears for the moment. The mainstream media hype and euphoria surrounding cryptocurrency have returned and voila, BTC is up nearly 23% in the last 7 days!
Of course, there are more fundamental occurrences happening behind the smokescreen of CNBC hype men shilling coins to millions of viewers but the fact that talking heads are excitedly discussing stratospheric future price projections after the carnage most investors endured during the last 3 months is comforting.
What’s really going on:
- Last week the Securities and Exchange Commission (SEC) began to reconsider applications for BTC exchange-traded funds (ETFs).
- Rockefeller’s venture capitalist division ‘Venrock’ partnered with Coinfund.
- George Soros indicated that Soros Fund Management approved plans to trade cryptocurrencies and similar whispers are being heard from Rothschild.
- Stratospheric price projects have returned and so far each one is supported by CNBC’s Brian Kelly. Tim Draper forecasting BTC at $250,000 by 2022, Thomas Lee says $25,000 by the end of 2018 and Dan Morehead of Pantera Capital projects $20,000 by years end.
Why is this important? Well, it could be the fulfillment of the institutional prophecy. Yes, you know the one where large financial institutions, hedge funds, and brokerages would inject nearly a trillion dollars into crypto markets, bringing market capitalization from a December 2017 high of $830 billion to 2 or 3 trillion throughout 2018.
While all of that is exciting, dependent upon your philosophy regarding decentralization and institutional whales buying up crypto, there is more…
- Tax day is nearly passed and selling to cover capital gains appears to have ended.
- BTC transaction fees are way down and the lightning network is ensuring that transactions are quick and cheap.
- At its lowest, Bitcoin was down 65% from its December 2017 high and with $6,300 – $6,500 is claimed as the bottom a turnaround was imminent.
Now that BTC has crossed $7,500 the most pressing question on the minds of investors are probably: Are we truly out of the woods yet and is this the beginning of a long-term reversal? Let’s have a look a the charts to see.
4 HR Chart
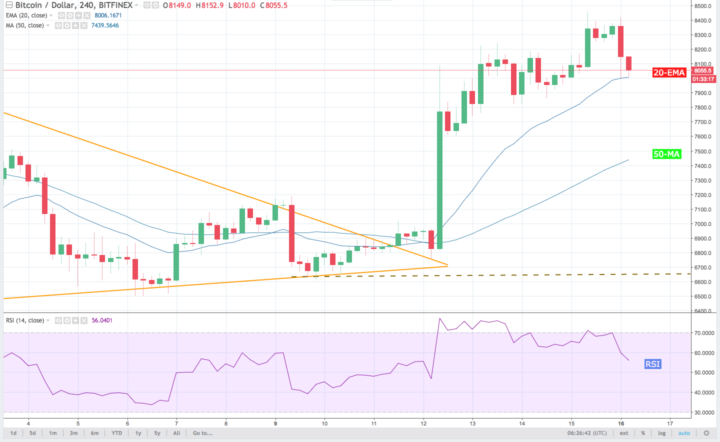

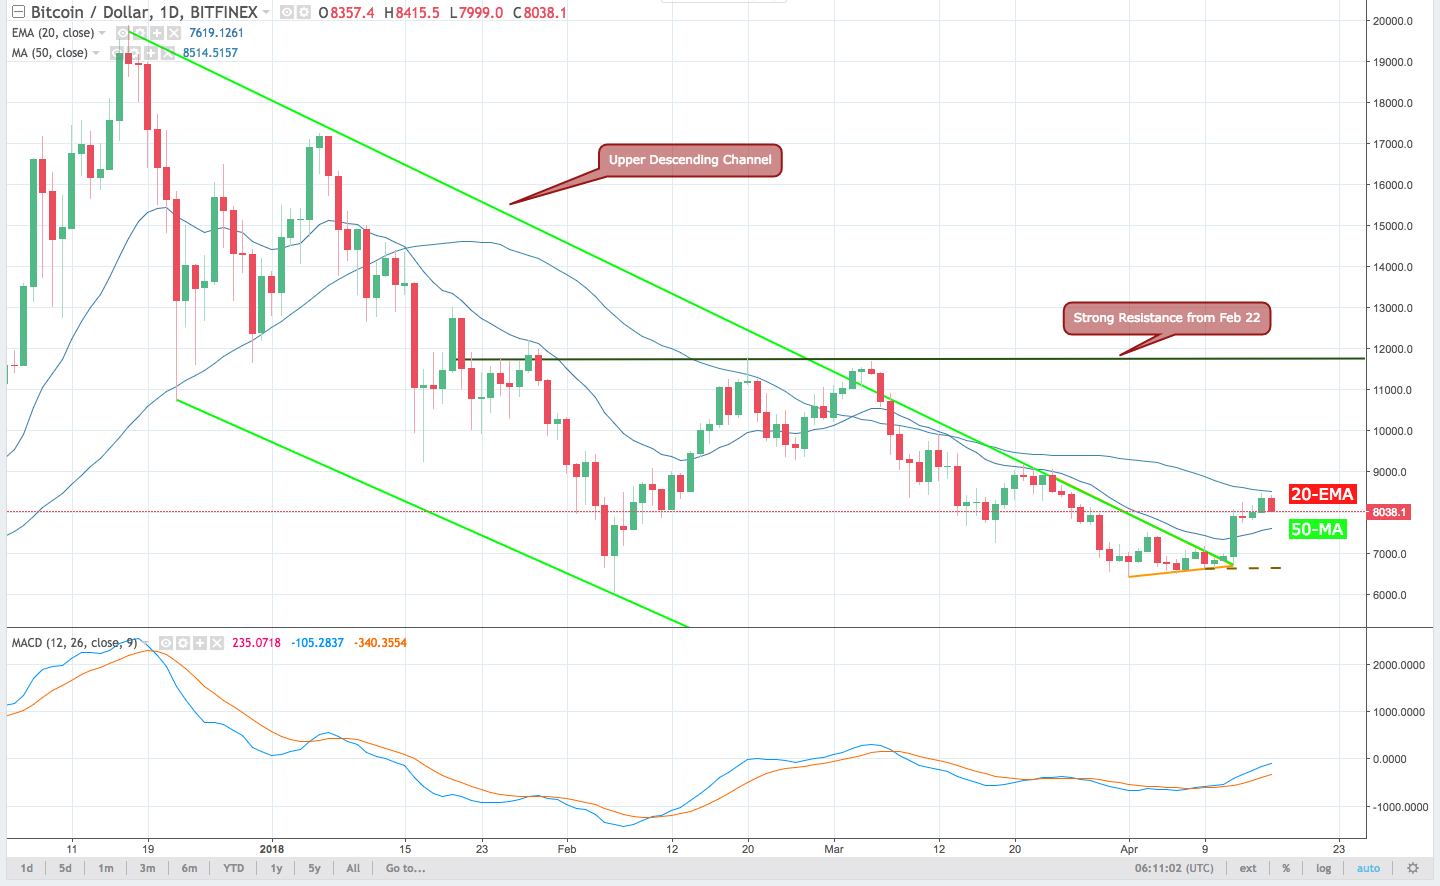
BTC has finally broken out of the descending channel indicating $6,300-6,500 as a bottom.
Since turning upwards and crossing at $6,873, the 20-day EMA and 50-day MA continued to climb while also putting distance between each other which shows the presences of bullish pressure but at the time of writing the 20 EMA and 50 MA have crossed downwards again. It should be noted that the 100-day-MA and 200 day-MA are still trending downward with the 100-day MA practically crossing the 200-day MA at the time of writing.

Currently, the 50-day MA stands as the most immediate resistance of $8,500 and above the 50-day MA, the next point of resistance is 9,200 followed by $10,000.
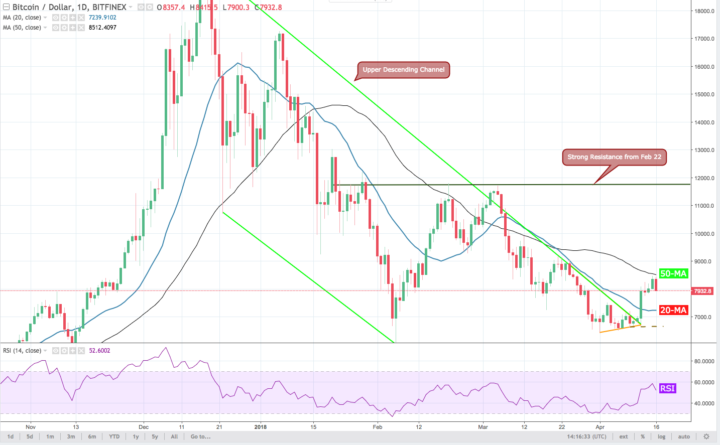
Daily Chart
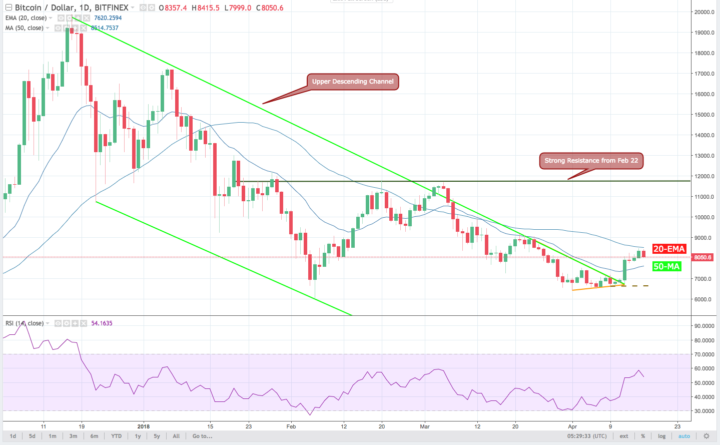
At the time of writing the both the RSI and Stoch are descending indicating overbought conditions which were to be expected as profit taking from $8,300 – 8,500 seems sensible.
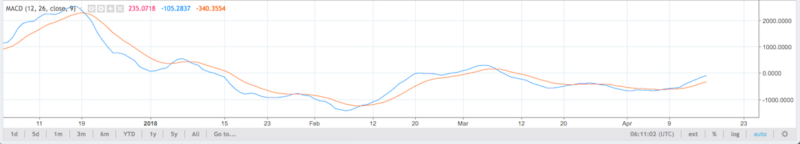
Meanwhile, the MACD still exhibits potential bullishness and it is likely that BTC will settle into a temporary range of $7,800 to $8,300 before breaking upwards towards $10,000 after it clears the $8,500 resistance level. While the short and long-term vision of BTC has turned positive it is important to remember that many of BTC’s previous support levels will now function as resistance shelves making the climb back to $10,000 and above a lengthy process that will be punctuated by profit-taking, regulatory scares, the turning tides of mainstream news and the issue of an uncountable number of investors who are still locked into their 2017 all-time high purchases.

Vision
- For the next day or two, profit taking will likely occur between $8,300 – $8,500 with buying appetite appearing near $7,800.
- BTC needs to overtake the 50-day MA ($8,500) which should up the door for an upward break towards $10,000.
- There is still major resistance at $12,200 and it could take some time for BTC to reach this point.
- In the long term, the return of positive interest and media coverage of BTC and will attract additional buyers.
- BTC appears to be reversing off its bottom and is currently trading above the descending channel.
Disclaimer: The views expressed in this article are not intended as investment advice. Market data is provided by BITFINEX. The charts for analysis are provided by TradingView.
How do you think the recent support of mainstream media and plans for investment by institutional investors will impact Bitcoin price? Let us know in the comments below!
Image courtesy of Wikimedia Commons, Tradingview.com