
On-chain data shows the Bitcoin Market Value to Realized Value (MVRV) Z-Score has declined to the lowest levels since the price was at $35,000.
Bitcoin MVRV Z-Score Has Plummeted Recently
In a new post on X, Glassnode analyst Chris Beamish has discussed about the latest trend in the Bitcoin MVRV Z-Score. This on-chain indicator calculates the difference between the market cap of BTC and its Realized Cap, and takes its ratio with the standard deviation of the market cap.
The Realized Cap here refers to a capitalization model for the asset that calculates its total value by assuming the ‘real’ value of each coin in circulation is equal to the price at which it was last transacted on the blockchain.
In short, what this metric represents is the amount of capital that the investors as a whole have put into the cryptocurrency. In contrast, the market cap is the value that they are carrying in the present.
As the Bitcoin MVRV Z-score compares the market cap with the Realized Cap, it essentially tells us whether the overall network is in a state of profit or loss.
Now, here is the chart shared by Beamish that shows the trend in the Bitcoin MVRV Z-Score over the last few years:

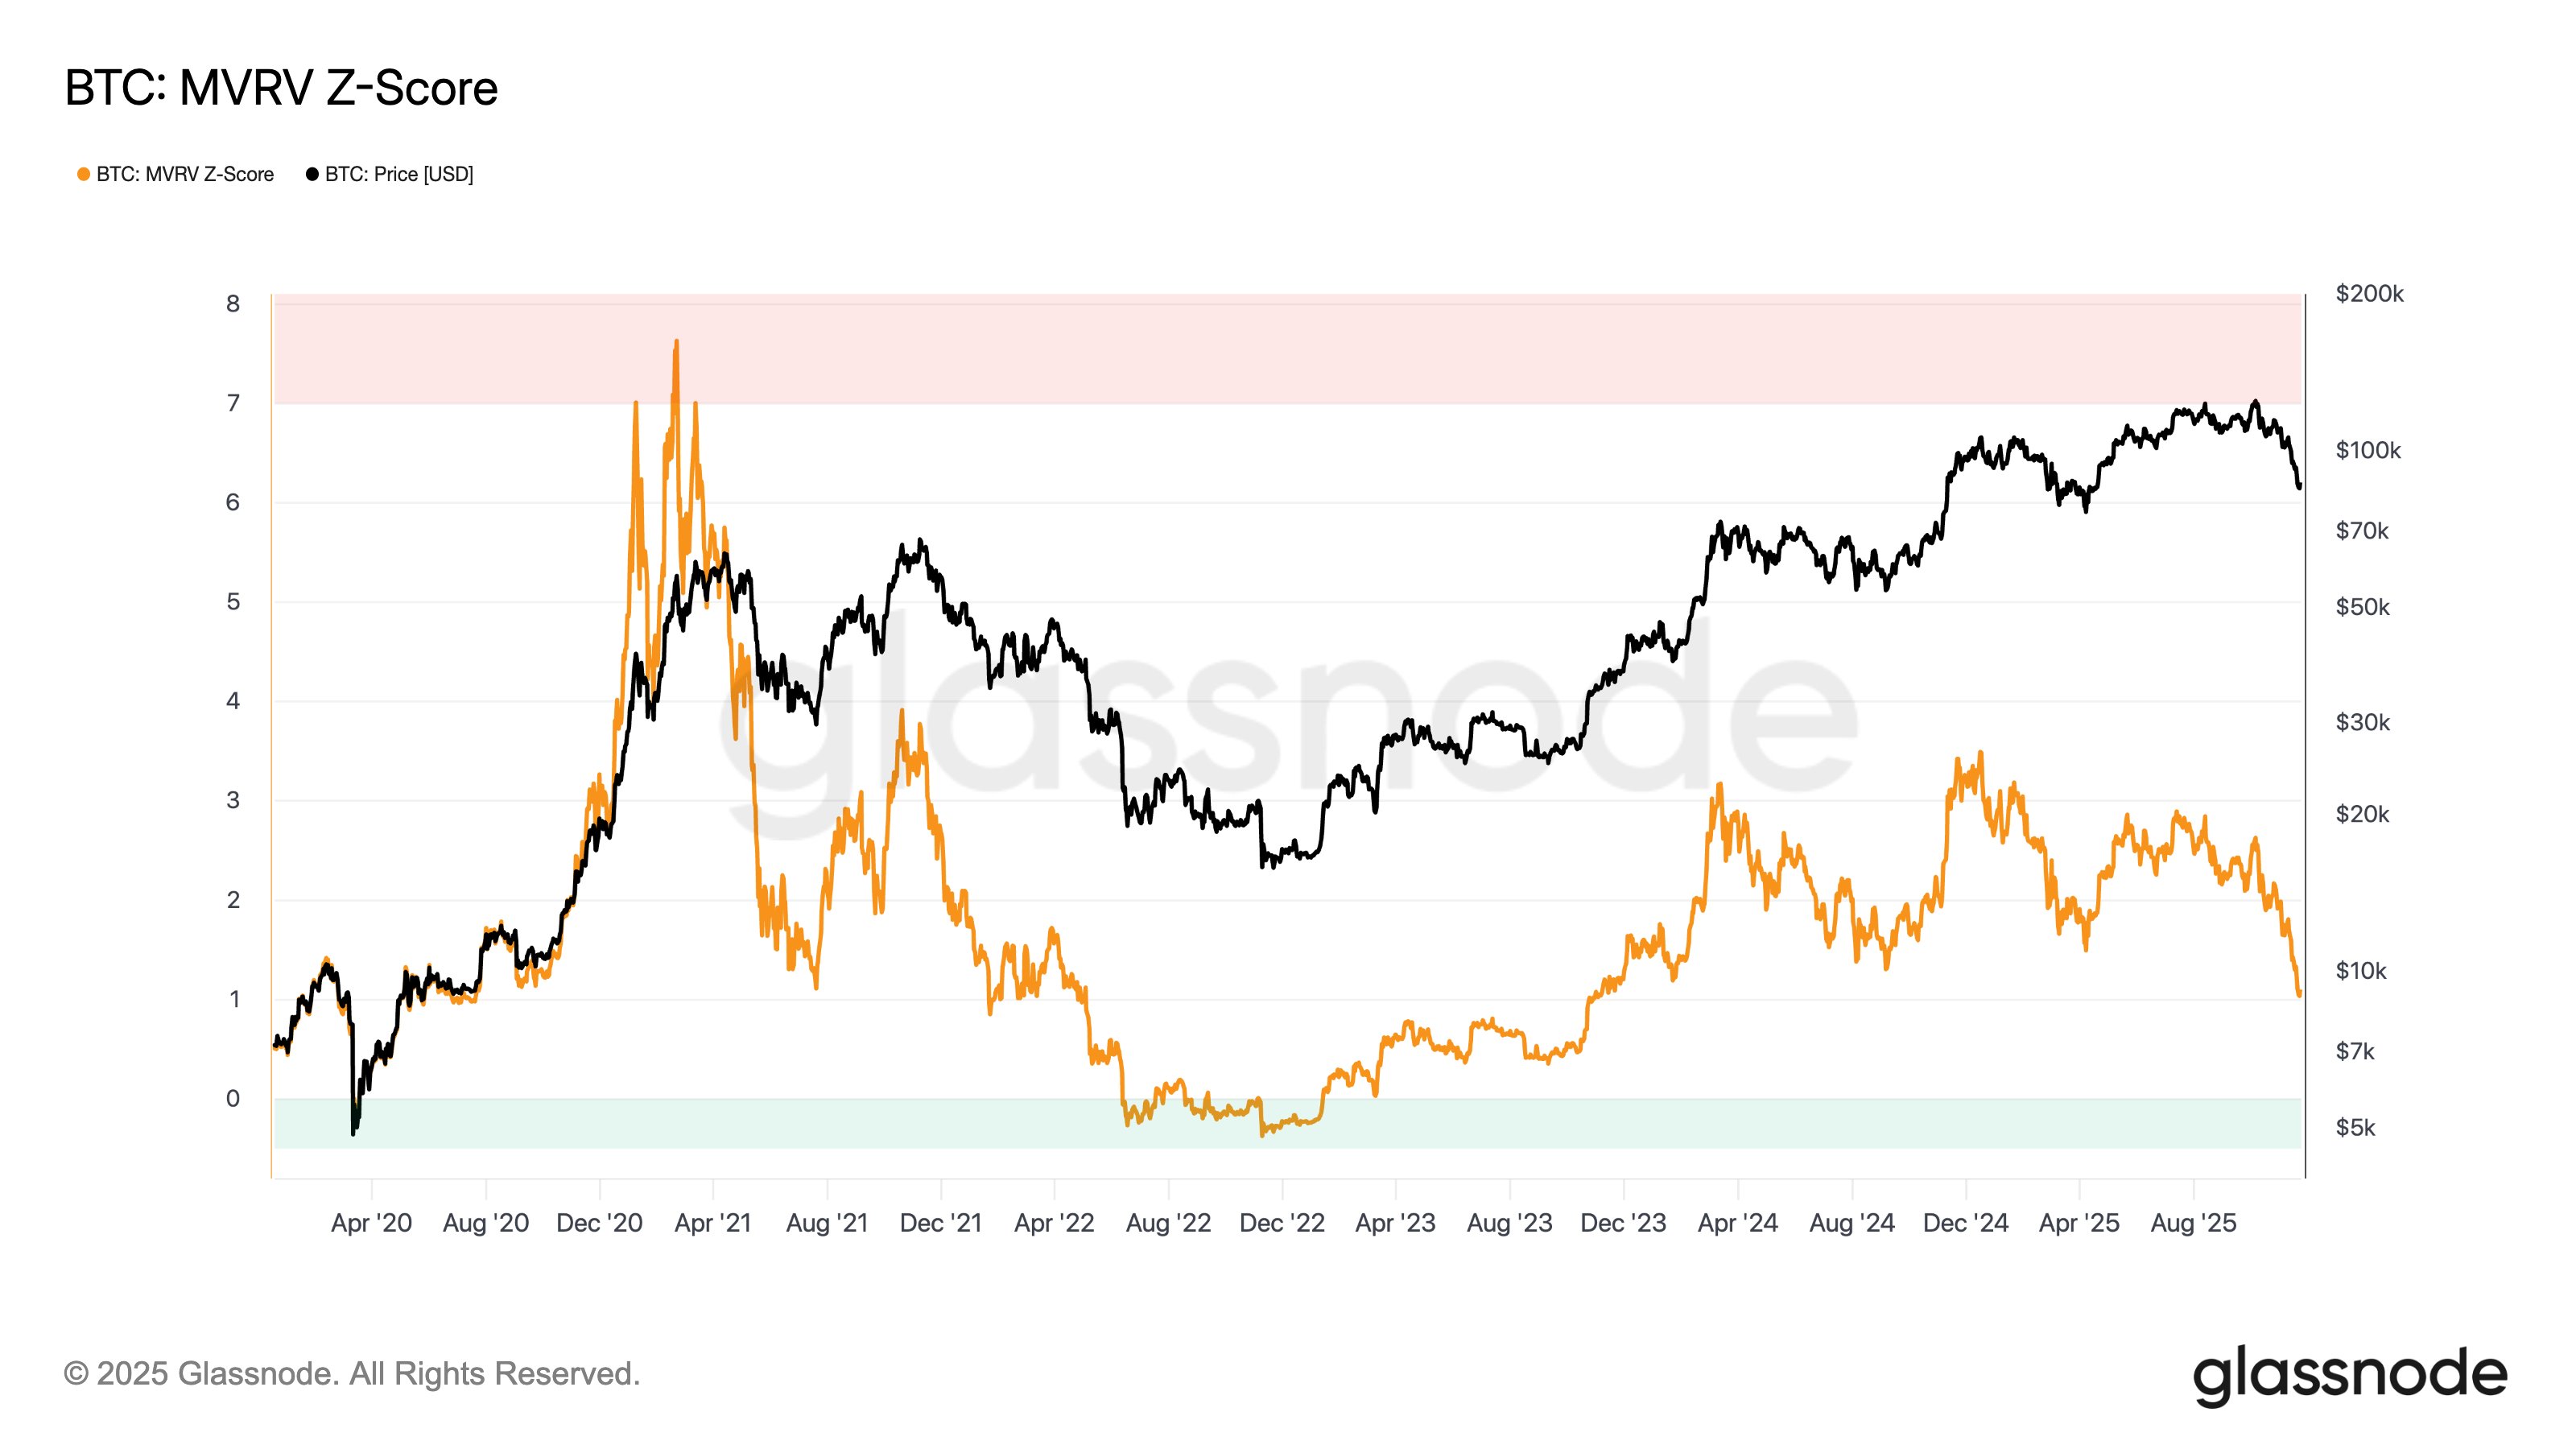
The value of the metric appears to have been heading down in recent weeks | Source: @ChrisBeamish_ on X
As is visible in the above graph, the Bitcoin MVRV Z-Score has gone through a decline recently. This drop in investor profitability is a result of the bearish trajectory that the cryptocurrency’s price has followed.
The metric is still a notable distance above the zero mark, which suggests the market cap continues to be greater than the Realized Cap. In other words, the investors are still in a state of net unrealized profit.
The degree of the holder gain, however, is low when compared to the profitability level of the last couple of years. In fact, the current MVRV Z-Score is at a similar level to when Bitcoin was trading around the $35,000 level.
Historically, a cooldown in investor profitability has facilitated bottom formations for the cryptocurrency. Usually, however, major bearish phases have only reached their lows when the network has outright gone underwater.
Currently, Bitcoin still has some ways to go before this can happen. Though, it’s possible that the current level is enough for the asset to reach a bottom, as it has already done a few times over this cycle.
Just like how a low value on the MVRV Z-Score can lead to a bottom, a high one can result in a top instead as profit-taking explodes. From the chart, it’s apparent that the metric reached an extreme level during the bull run in the first half of 2021.
So far in the current cycle, no peak in the indicator has been of a similar scale; the tops this time around have formed at a comparable profitability level to the second-half 2021 bull run.
BTC Price
Bitcoin has rebounded since its low below $81,000 on Friday as its price has now climbed back to $88,600.

The trend in the price of the coin over the last five days | Source: BTCUSDT on TradingView