

- Bitcoin has faced a slight retracement since the $16,500 highs set a few days ago.
- The leading cryptocurrency has dropped to $16,000 as of this article’s writing and fell as low as $15,700 on Saturday morning.
- Despite this, Willy Woo said that the on-chain fundamentals remain bullish.
Bitcoin Remains Bullish: Willy Woo
Bitcoin has faced a slight retracement since the $16,500 highs set a few days ago. The leading cryptocurrency has dropped to $16,000 as of this article’s writing and fell as low as $15,700 on Saturday morning.
Analysts fear that this drop is the start of a stronger move to the downside. The cryptocurrency flirting with the $16,000 support is a worrying sign, to be sure.
But according to Willy Woo, a prominent on-chain analyst, there is not a big reason to be concerned.
He did admit that Bitcoin’s short-term technicals are in a bearish state, with there being a bearish four-hour relative strength index divergence and a Tom Demark Sequential 9″ on the eight-hour chart. Though, he added that what really matters, the on-chain fundamentals, remain bullish.
Woo specifically highlighted two on-chain trends taking place: 1) the increase in the number of Bitcoin being sent from exchanges to customer wallets, and 2) the increase in the number of new and active users of the Bitcoin network:
“Weekend trading setup: Shaking off some bearishness technicals (4h RSI div, 8h TD9). Short and mid term on-chain fundamentals bullish, more coins scooped off exchanges, more users arriving. Buy the dip scenario.”
Weekend trading setup:
Shaking off some bearishness technicals (4h RSI div, 8h TD9).
Short and mid term on-chain fundamentals bullish, more coins scooped off exchanges, more users arriving.
Buy the dip scenario.
— Willy Woo (@woonomic) November 14, 2020
Not the Only Bull That Thinks So
Woo isn’t the only bull that thinks Bitcoin will continue its ascent in the coming days. A trader recently commented on BTC’s price action, arguing that a move to $17,000 or $18,000 could take place in the near future:
“I think there’s a decent chance bitcoin breaches $17k and even into $18k in the next 10 days (next weekly candle). We are due for a decent mid timeframe blowoff and chill for a bit and wicking into the ATH cluster just feels so right… The path to $18k or ATH wick seems the path of least resistance. Nobody wants to sell until then and everybody is buying dips. Easiest way to create market balance is to do it quickly then let the market chop around a bit.”
The same trader that predicted Bitcoin would see a V-shaped reversal in March recently shared the chart below, which suggests a move to $17,000:

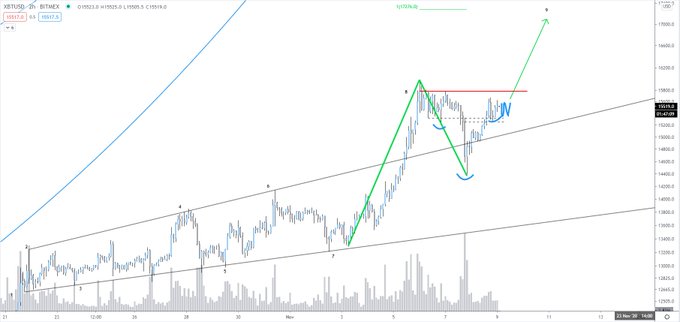
Chart of BTC's price action over the past two weeks with analysis by crypto trader Bitcoin Jack (@BTC_JackSparrow on Twitter).
Source: BTCUSD from TradingView.com
Featured Image from Shutterstock
Price tags: xbtusd, btcusd, btcusdt
Charts from TradingView.com
Bitcoin's On-Chain Fundamentals Still Bullish, Says Leading Analyst