

- Bitcoin’s price action hasn’t been providing investors with many insights, as it has primarily stagnated as it trades around $10,700
- The cryptocurrency market is currently resting on the edge of a blade as investors closely watch to see where BTC may trend in the near-term
- One trend that seems to point to underlying bullishness is a spike in activity seen amongst new market participants
- While speaking about this, one on-chain analyst said that this spike in activity coming amidst bearish price action has created a bullish divergence
- This could mean that upside is imminent for the cryptocurrency
Bitcoin has been consolidation between $10,200 and $11,200 for the past couple of weeks, but this trading range has narrowed as of late.
The cryptocurrency is now caught between $10,600 and $10,800, with bulls and bears reaching an impasse as its volatility and trading volume both show signs of dwindling.
Where the entire market trends next will likely depend largely on BTC, as altcoins have lost virtually all of their momentum throughout the course of this consolidation phase.
That being said, one trader is now pointing to an influx of new investors into the market, noting this is a bullish sign.
Bitcoin’s Volatility Dwindles as Consolidation Persists
At the time of writing, Bitcoin is trading down 1% at its current price of 1%. This is around where it has been trading throughout the past few days and marks a narrowing of a much wider range formed over the past two weeks.
This range exists between $10,200 and $11,200. Until one of these levels is broken above or below, the cryptocurrency still remains relatively trendless.
The entire crypto market’s outlook also hinges on BTC’s reaction to these levels, as virtually all altcoins have been seeing tempered price action as they observe the benchmark cryptocurrency.
On-Chain Analyst: Bullish Divergence Seen While Looking at New BTC Investors’ Activity
Willy Woo – a respected on-chain analyst – explained in a recent tweet that he is witnessing a bullish divergence between Bitcoin’s dwindling price and the uptick in activity amongst new crypto market participants.
He reckons that this is a bullish trend, indicating that upside is imminent for BTC.
“We’re seeing a spike in activity by new participants coming into BTC not yet reflected in price, it doesn’t happen often. This is what traders call a divergence, in this case it’s obviously bullish.”
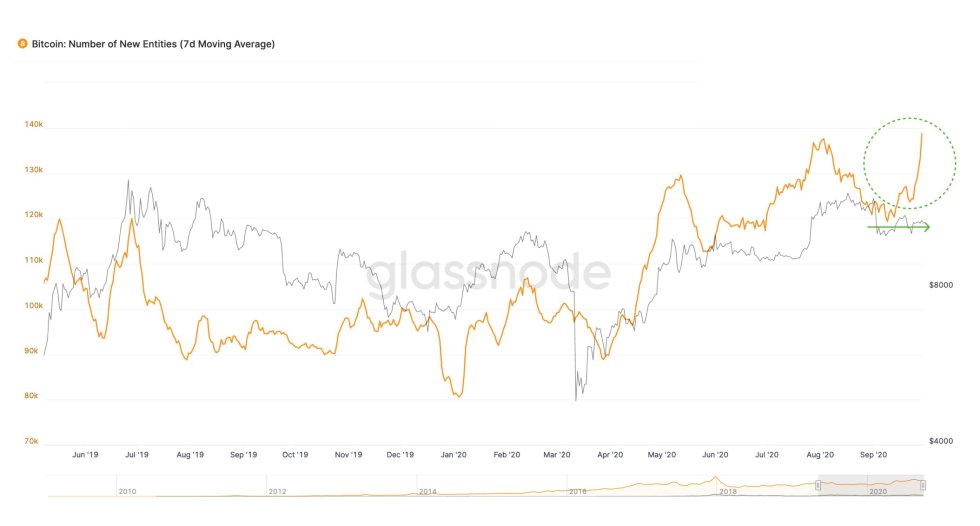

Image Courtesy of Willy Woo. Chart via Glassnode.
Once this trend does get reflected in Bitcoin’s price, it could help guide it above the upper boundaries of the current ranges it is caught within.
Featured image from Unsplash.
Pricing data from TradingView.