

- Bitcoin’s weekly candle close is coming up. It is set to take place in around two hours after this article’s publishing time.
- BTC is trading flat in the past 24 hours, having found support in the $11,800 region. Bitcoin traded at $12,000 on Saturday.
- The weekly candle close has long been an important event to watch for traders across the industry.
- Here’s the level that analysts are watching for Bitcoin to confirm their bullish bias moving forward.
- If BTC closes above the level in question, there are analysts eyeing a move towards $13,000-14,000.
Bitcoin Confirming This Level As Support at the Close is “Key”
Last week, Bitcoin did what many thought would be extremely difficult: BTC closed its weekly candle above $11,500. $11,500 has been a pivotal level for the asset for the past two years; Bitcoin failed to surmount that level on a weekly basis in early 2018 and at the 2019 highs.
Despite the move above $11,500, trader Josh Rager thinks that Bitcoin is facing down another important level.
Referencing the chart below, Rager wrote on August 16th:
“$BTC. Weekly close tonight – with price above weekly open as closing above $11,685 will be key. A daily close above $11,895 would also be a higher-high and bullish. Watch these levels as daily closes tonight.”

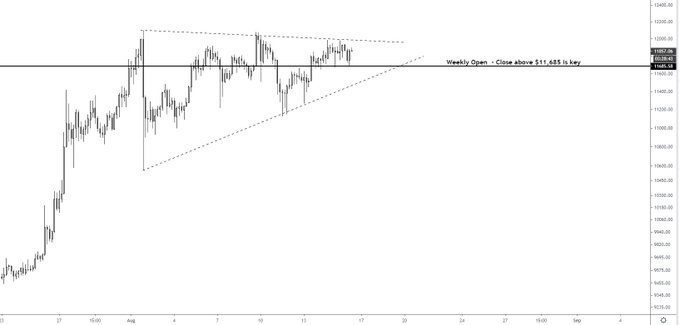
Chart of BTC's price action over the past few weeks with an analysis by trader and Blockroots founder Josh Rager (@Josh_Rager on Twitter).
Chart from TradingView.com
Rager isn’t the only analyst eyeing the $11,685 region as a level for Bitcoin to close above to confirm their bullish bias. One pseudonymous analyst wrote that $11,760 is also key:
“$BTC. I’m still bullish, but cautious here – HTF close above the $12130 level you can see on my BTC charts and its game on, but we could easily reject from there and take liquidity from the $8.8-9k area. Weekly close below 11760 wouldn’t look too good.”
Where’s BTC’s Next Stop? Analysts Weigh In
If Bitcoin closes above the levels the analysts aforementioned identified, where can we expect BTC to move towards?
According to commentators, a move towards $13,000 is entirely on the table.
One trader explained, as reported by Bitcoinist previously, that $13,000 is entirely possible due to that level being a “yearly pivot”:
“I think BTC will go for the 13K$ area, which is yearly pivot resistance. That’s where I’ll look to hedge my remaining stack fully and wait to see if it holds or keeps going. IMO we’re close to topping, not here yet. Too much pressure at rally’s high not to give another push.”
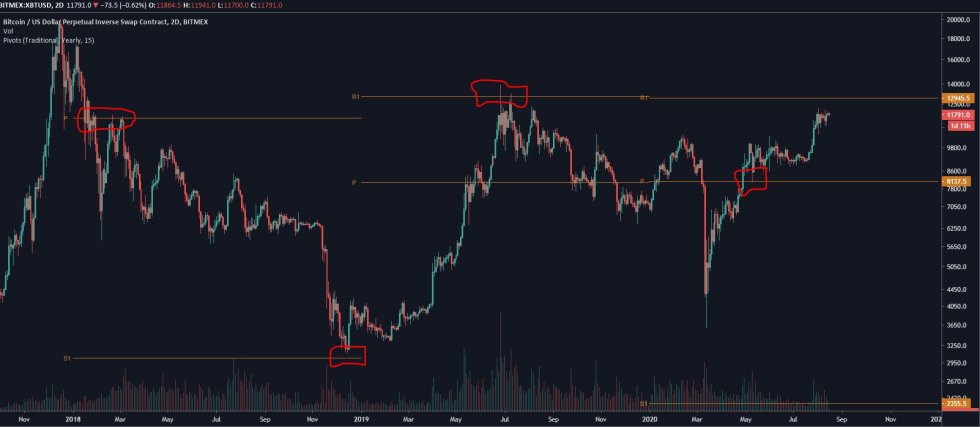

Image Courtesy of SalsaTekila. Chart via TradingView.
Others agreed with this, noting that the next level of macro importance after $11,500 is $13,000.
Featured Image from Shutterstock
Price tags: xbtusd, btcusd, btcusdt
Charts from TradingView.com
Here's the Level Bitcoin Traders Should Be Watching for the Weekly Close