

Data shows Bitcoin trading volume has been on a decline recently, here is what it mean for the current BTC bull rally.
Bitcoin Trading Volume Continues To Decline
As per the latest report from Arcane Research, the 7-day average BTC trading volume has been on a decline this month. and is now close to $4 billion.
The real Bitcoin 7-day average trading volume is an indicator that shows the total amount of Bitcoin transacted in the network daily after taking the average over a week’s period.
The metric’s values can tell us about the volatility of the BTC market; higher the values, more volatile is the market.
Here is the chart that shows how the metric’s value has changed over the past year:
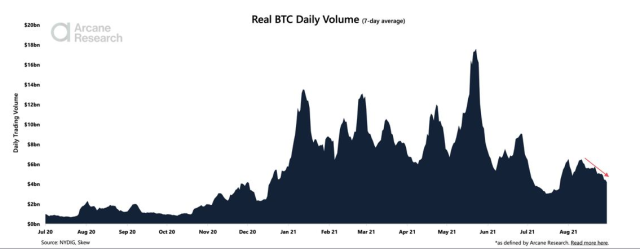

The BTC trading volume seems to be going down | Source: Arcane Research Weekly Update - Week 34
The above graph reveals some interesting facts about the Bitcoin trading volume. The ATH on the graph naturally happened during May 2021, around the time of BTC’s crash.
Related Reading | Bitcoin Dry Powder Accumulates On Exchanges As Stablecoins Exceed $19 Billion
Throughout the 2021 bull run, the indicator maintained consistently high values. This behavior makes sense as a highly volatile market is suitable for making big moves.
After the crash, the volume started declining and hit a yearly low in July 2021. During the recent upwards movement, the indicator had a revival, but it wasn’t soon after that it started dropping off again.
Now its value is around $4 billion, similar to what it was around January 2021. If the downtrend continues, the indicator’s value might reach back the same yearly lows of July 2021.
What Do Low Trading Volumes Mean For BTC’s Price?
As already mentioned before, high trading volumes imply more volatility in the market. During big moves, the indicator has historically been at pretty high values.
For a continued push upwards, the Bitcoin market requires relatively high values of the metric. The first time BTC reached the $50k level, the trading volume shot straight up. In comparison, the current push for the $50k level has been rather weak.
Related Reading | Institutional Investors Not Slowing Down On Bitcoin, Here’s How Much They Own
Now, the question is, what could be the reason behind these low values? Well, there are two possible explanations. The first is that investors are just disinterested in Bitcoin at the moment. Such a scenario could prove to be bearish for the market.
The other possibility is that the market has more long-term buyers now who are waiting for a big price move to change their positions in the market. If this holds true, then the overall sentiment among investors could be bullish.
At the time of writing, Bitcoin’s price is around $47.4k, down 1.9% in the last 7 days. The below chart shows the trends in the price of the coin over the past three months:
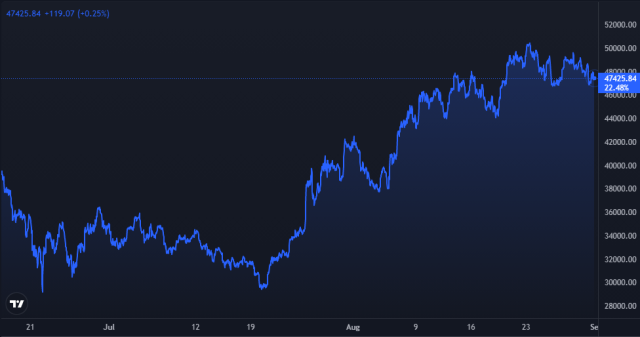

BTC continues on the downtrend | Source: BTCUSD on TradingView