

On-chain data shows that Bitcoin investors have shifted towards aggressive accumulation recently, something that may help sustain the rally longer.
Bitcoin Accumulation Trend Score Has Tended Towards 1 Recently
According to data from the on-chain analytics firm Glassnode, there is a structural similarity forming between the current and 2018-2019 BTC cycles. The indicator of interest here is the “accumulation trend score,” which tells us whether Bitcoin investors have been accumulating or distributing over the past month.
This metric’s value represents not only the number of coins that the holders are selling or buying but also the wallet sizes of the entities that are taking part in the accumulation or distribution trends.
When the accumulation trend score has a value near the 1 mark, it means the large entities (or a huge number of small investors) are accumulating the asset currently.
On the other hand, the indicator having values close to the 0 levels suggests holders are distributing (or alternatively, just not accumulating much) at the moment.
Now, here is a chart that shows the trend in the Bitcoin accumulation trend score over the last few years:

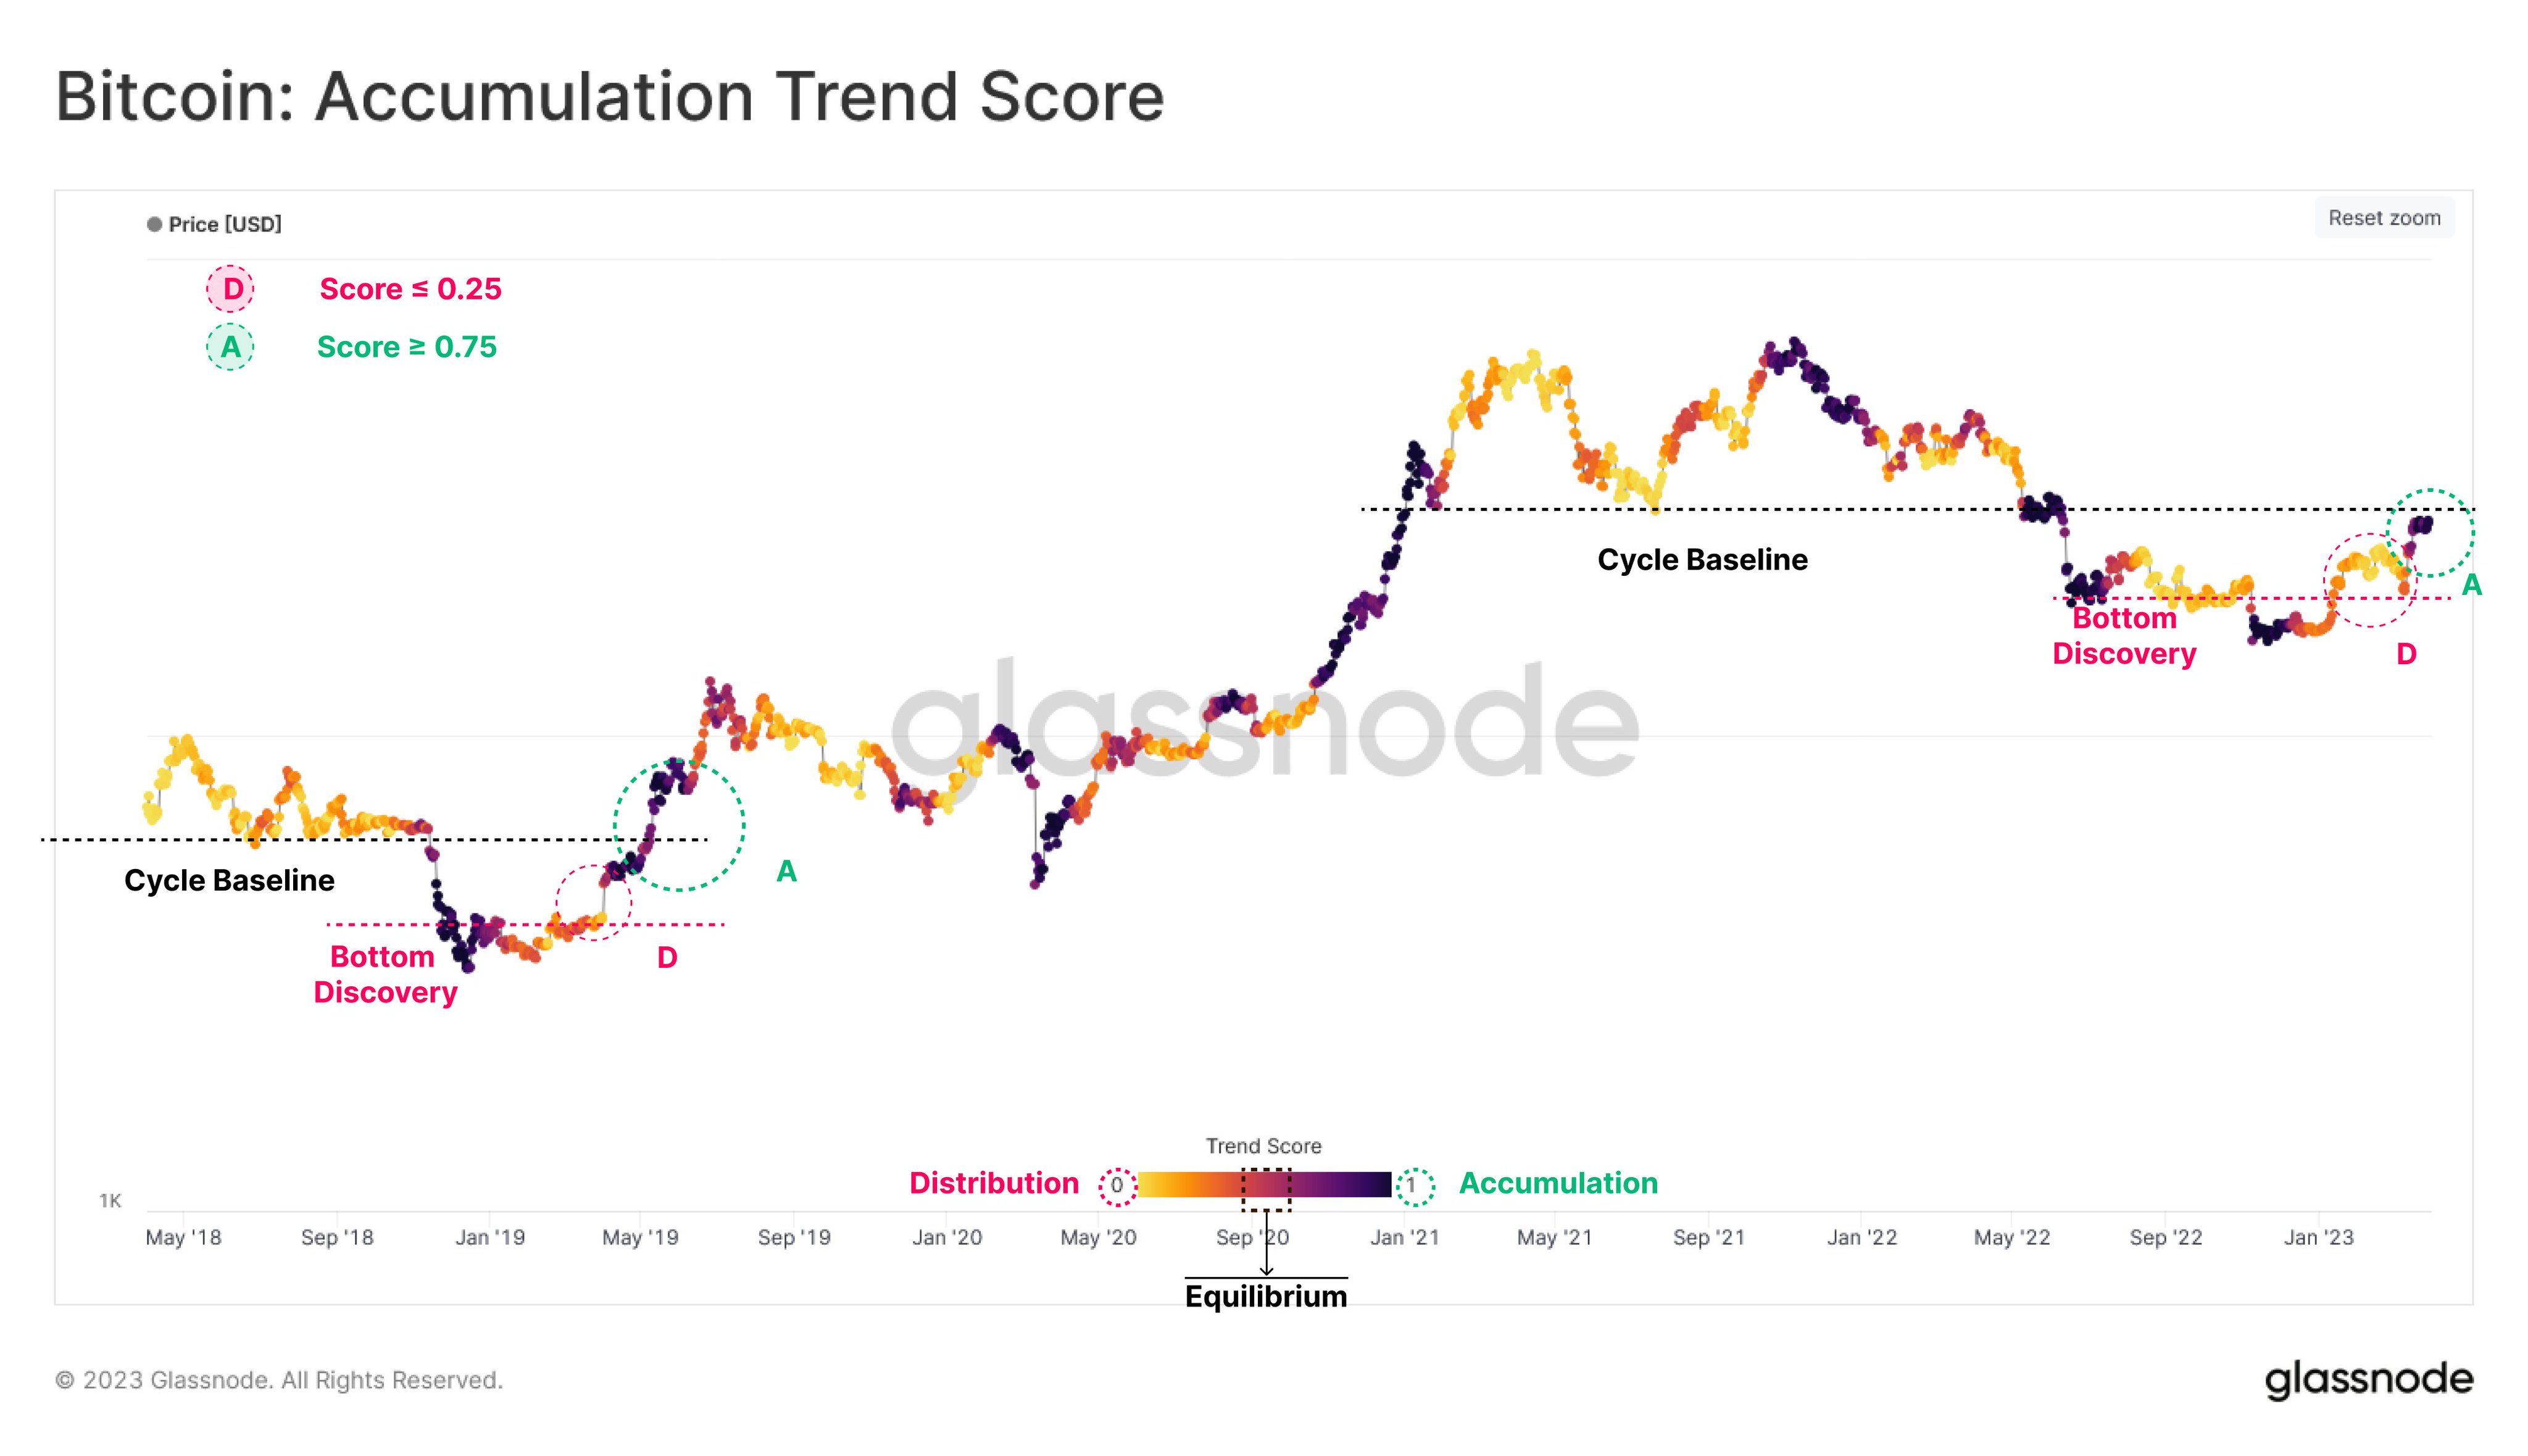
The value of the metric seems to have been close to the one mark recently | Source: Glassnode on Twitter
As displayed in the above graph, the Bitcoin accumulation trend score had assumed yellow/orange shades during the first couple of months of the latest rally. This means that the metric had values close to 0 then, implying a large amount of distribution was taking place from the large entities.
This suggests that the investors may not have thought this rally would go on for too long so they were harvesting their profits while they still could. The trend, however, has changed during the latest stretch of the rally, which has taken the price close to the $30,000 level.
Interestingly, the trend that the current rally is following seems to be similar to what was seen during the April 2019 rally. This other rally started out of bear market lows, just like the current one (if indeed the worst of the bear is behind the asset for this cycle), and it also faced heavy distribution in its initial stages.
When the April 2019 rally neared the “cycle baseline” (a price that supported the asset multiple times throughout that cycle), the investor behavior shifted towards heavy accumulation as the indicator turned dark purple (values very close to 1).
From the chart, it’s visible that the April 2019 rally gained some sharp upwards momentum after this accumulation began. As mentioned before, the latest Bitcoin rally has also shifted towards accumulation recently as the price has approached the $30,000 mark.
The $30,000 level happens to be the baseline of the current cycle, which means that this structure that the market is observing right now is reminiscent of what was seen in the 2018-2019 cycle.
If the rest of the rally also shows a similar pattern to the April 2019 one, then the latest shift towards accumulation from the investors could be positive news for the price surge.
BTC Price
At the time of writing, Bitcoin is trading around $28,300, up 1% in the last week.

BTC has mostly moved sideways recently | Source: BTCUSD on TradingView