

- Bitcoin saw a strong push higher today despite some weakness yesterday
- Where the benchmark cryptocurrency trends in the near-term will depend largely on whether or not bulls can flip the resistance at $16,500
- A break above this level would open the gates for a move into the $17,000 region
- The coming few days and weeks should provide some serious insights into where the markets will trend in the days and weeks ahead
- One trader is now noting that the cryptocurrency is nearing a high time frame resistance level
- He believes that where the entire market trends in the near-term will depend largely on its reaction to this level
Bitcoin has been showing signs of strength throughout the past day, with yesterday’s slight downtrend resulting in it seeing a prolonged bout of sideways trading.
Where the aggregated market trends in the mid-term should depend largely on whether or not Bitcoin can continue holding above the lower-$16,000 region for an extended period of time.
One trader is noting that although BTC is trading around a high time frame resistance level, he believes that it is flashing signs of strength on its lower time frames.
Whether or not that can push BTC above $16,500 remains to be seen.
Bitcoin Bears Struggle to Gain Momentum as Uptrend Continues
At the time of writing, Bitcoin is trading up just over 2% at its current price of $16,370. This is around the price at which it has been trading throughout the past few days.
BTC was able to post its weekly candle close above $16,000, a positive development for bulls. This was the third-highest weekly candle close ever seen by the cryptocurrency. It was only a few dollars behind its second-highest close.
Its current strength may be coming about as a result of this.
BTC Nears Key Resistance as Bulls Roar
One trader said that although Bitcoin is flashing signs of low time frame strength, it is nearing a high time frame resistance level that may slow its ascent.
“BTC: HTF right at resistance. Previous weekly high retested and flipped. LTF looks pretty bullish. Hold low 16000s (16150-16060) and I think we’ll see new highs this week.”
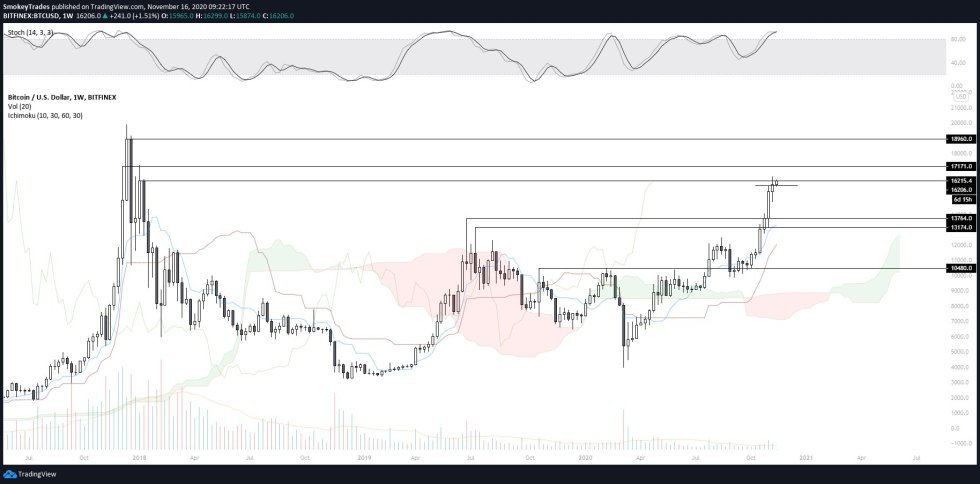

Image Courtesy of Smokey. Source: BTCUSD on TradingView.
How Bitcoin responds to these key levels throughout the week should shed some light on where it will trend throughout 2020.
Featured image from Unsplash.
Charts from TradingView.