

The Bitcoin price has risen by more than 28% since January 1, posting an impressive rally to start the year. The price movement has been driven by the global financial market’s expectation that the U.S. Federal Reserve will continue to slow its pace of interest rate hikes before the pivot comes later this year.
According to Bitcoin on-chain analysis pioneer Willy Woo, this has resulted in the market now being in the “disbelief” phase of the cycle. Woo refers to the chart below, which is usually used to describe market cycles in all financial markets, and said: “I suspect we are in the “disbelief” phase of the cycle.”
Woo claims that BTC has already passed through the panic, anger, and depression phases, and is thus at the end of the cycle, and about to enter a new market cycle.
In the current phase, traders’ sentiment is dominated by the motto, “This rally will fail like the others.” and “This is a suckers rally.” An opinion that is currently very common on crypto Twitter. Once the phase of disbelief is over, hope for a possible recovery emerges.

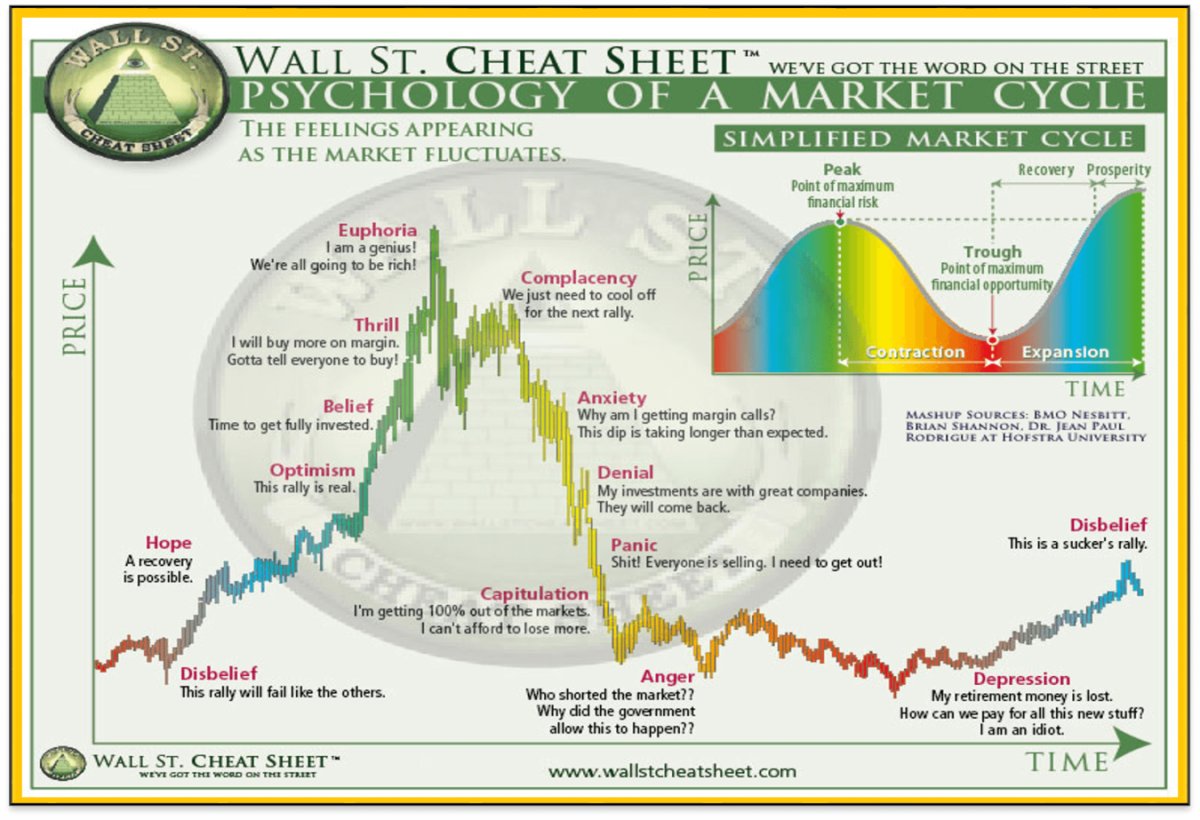
Bitcoin On-Chain-Data Suggests Disbelief Phase
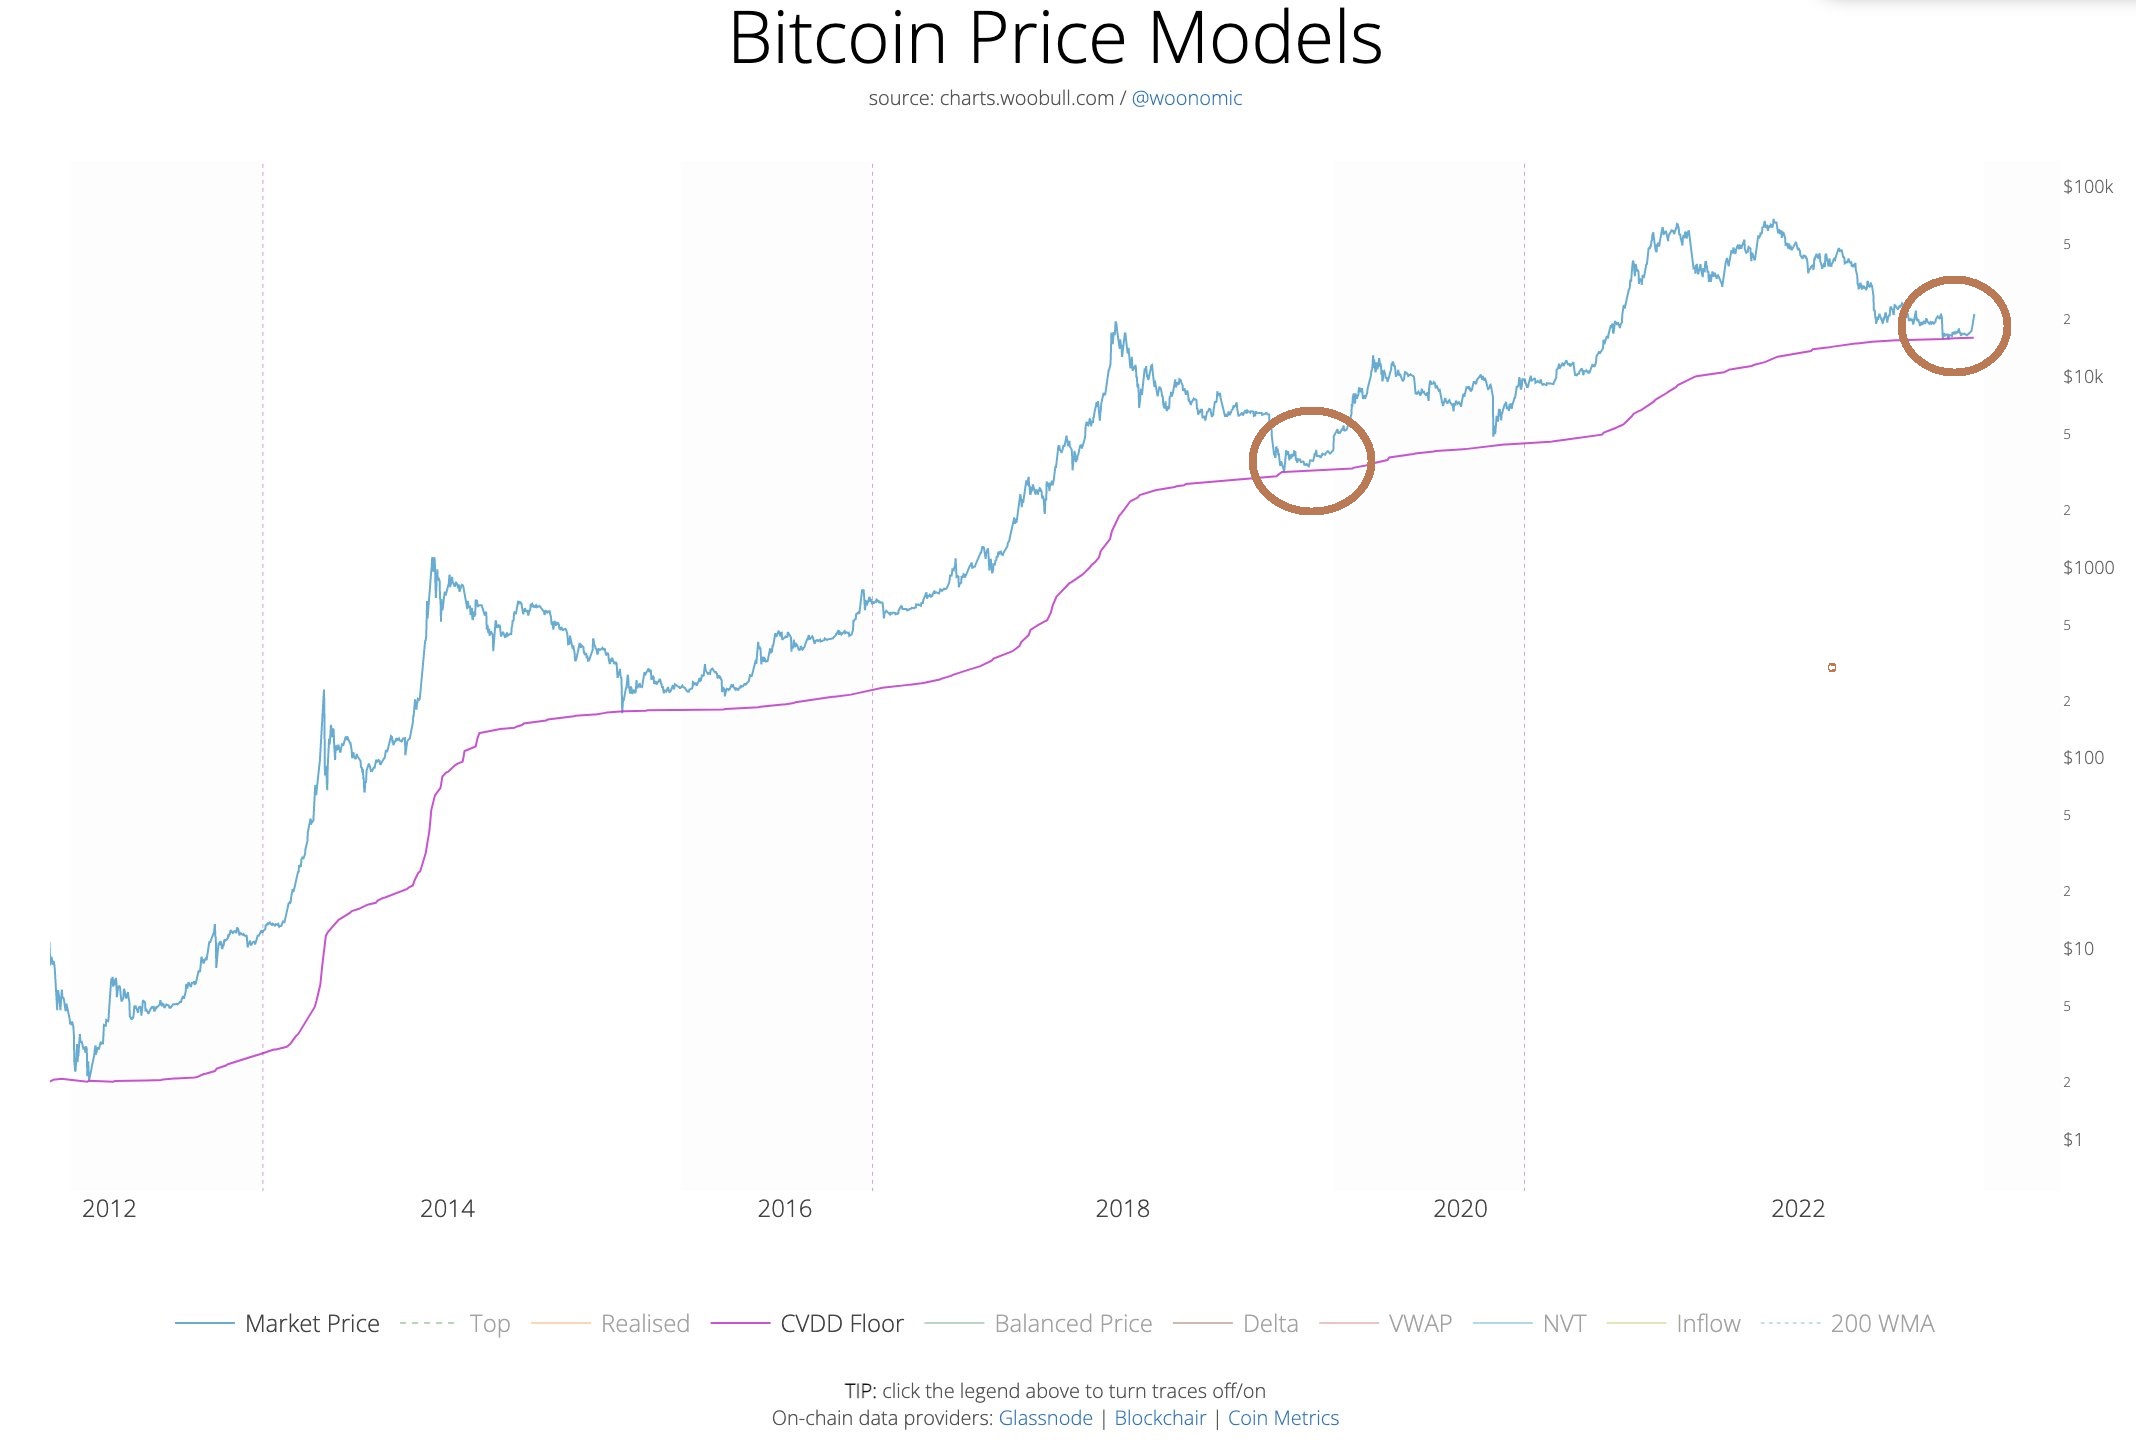
To support this thesis, the renowned on-chain analyst cites three key on-chain metrics, the first being CVDD (Cumulative Value Days Destroyed). This, according to its inventor Woo, has historically identified the bottom of the market.
It is based on the theory that the market perceives a higher floor when old coins (e.g., bought at $1,000) are passed on to new investors (e.g., at $10,000). In the chart, it can be seen that the CVDD Floor has been successfully defended since the end of November, as Woo stated:
CVDD Floor (circa 2019) successfully defended for 2 months straight, the first proper test apart from COVID where the crash got close. Hope this is not famous last words :). Spot momentum has been strong throughout this move, there was also solid accumulation for months at 16k.

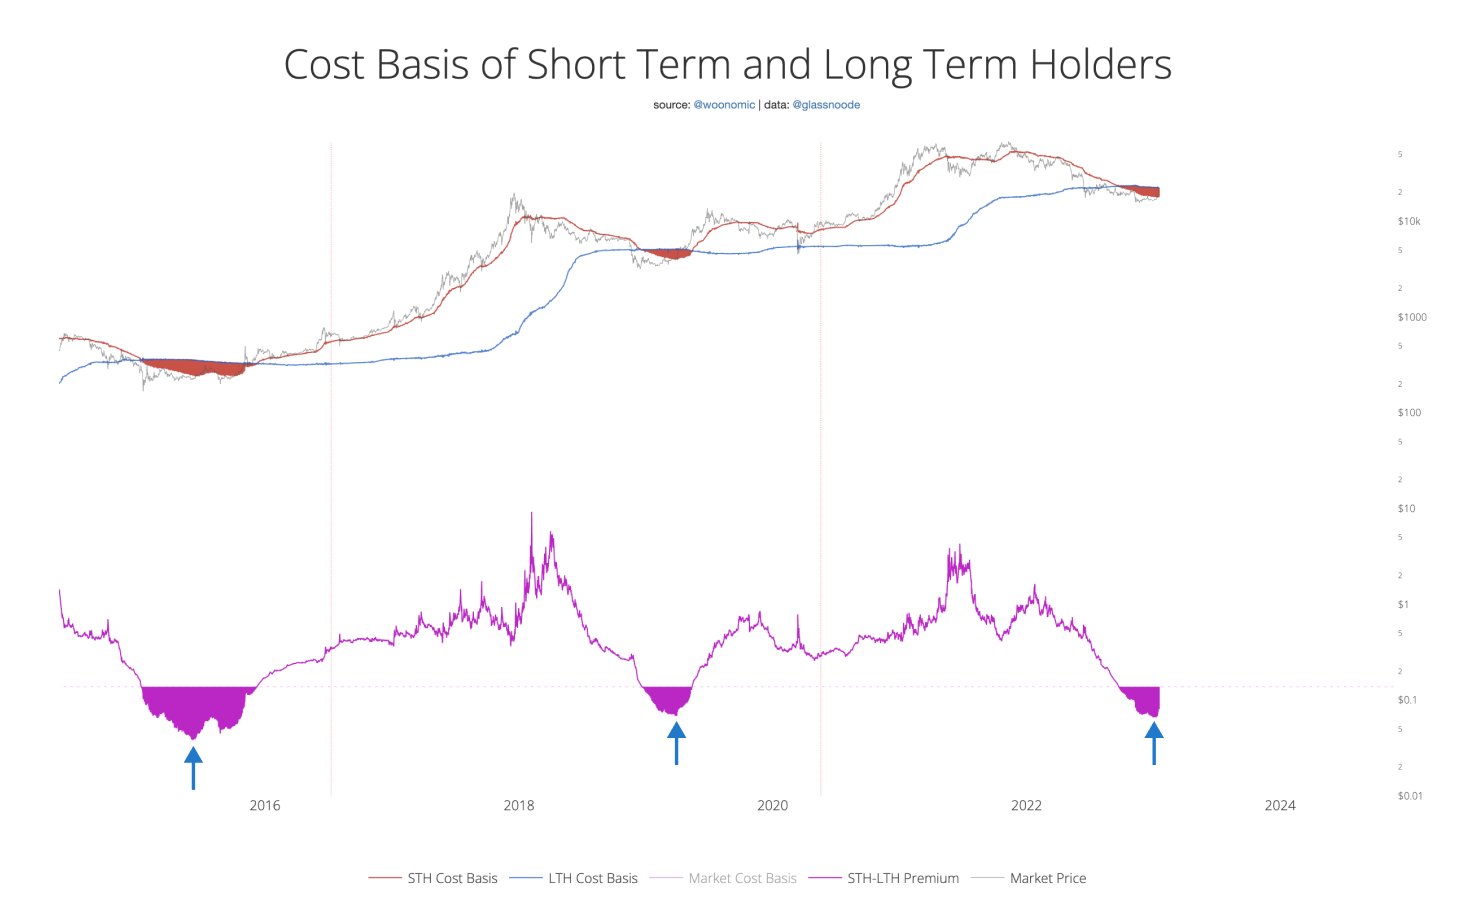
Another indicator that Bitcoin has found its bottom is the cost basis comparison. The peak discount that short-term buyers had over long-term buyers has peaked.
“It’s only at the deep parts of a bear market do short term coins get cheaper than long term coins,” Woo explained and shared the following chart.

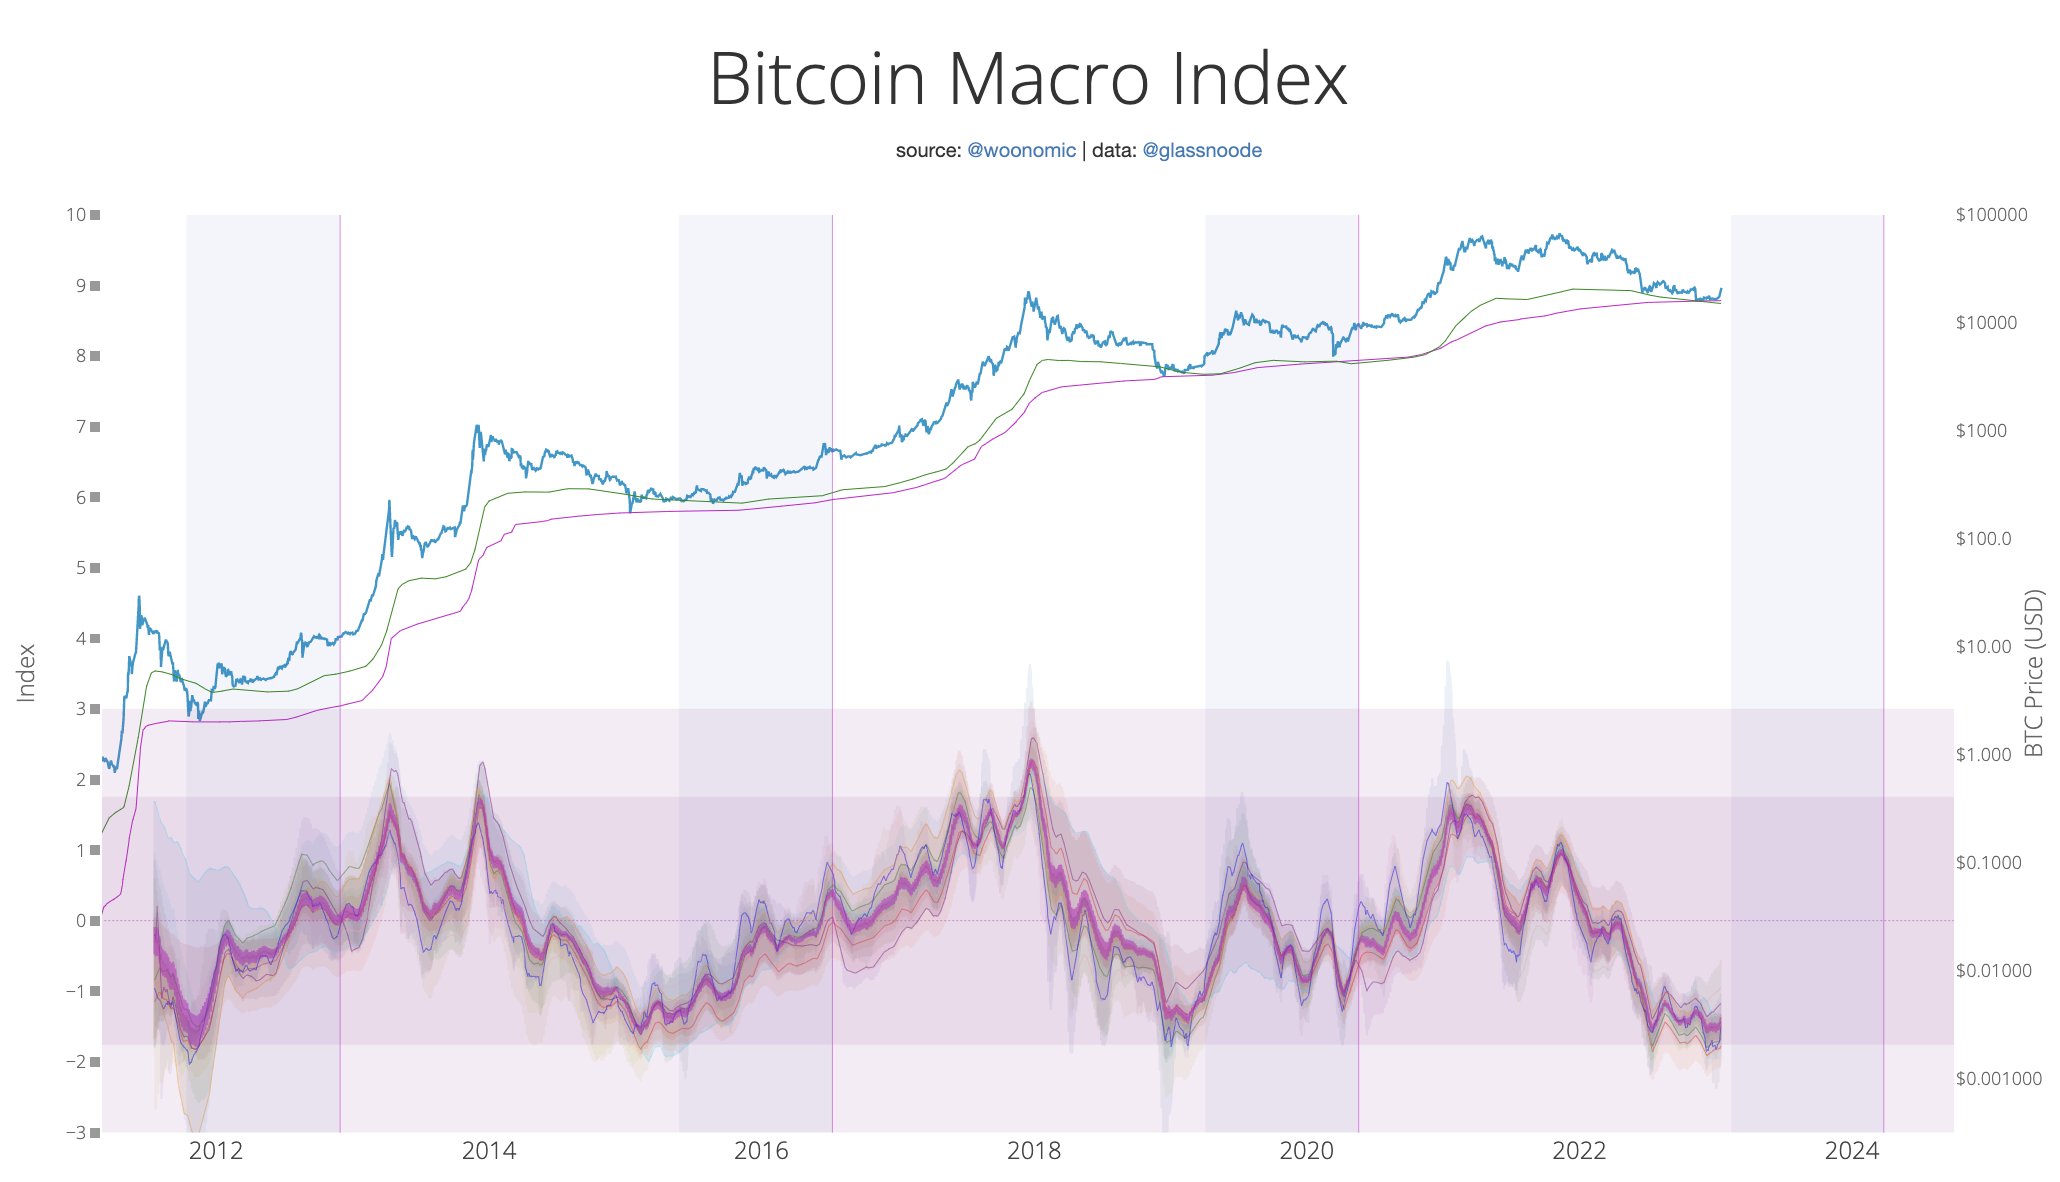
Third, the analyst cites the BTC macro index, which signals a “pretty safe” time to buy. “Look at the vertical bisection bands; we are now about 1 month away from the period where the market’s reaccumulation phase starts to engage,” Woo says.

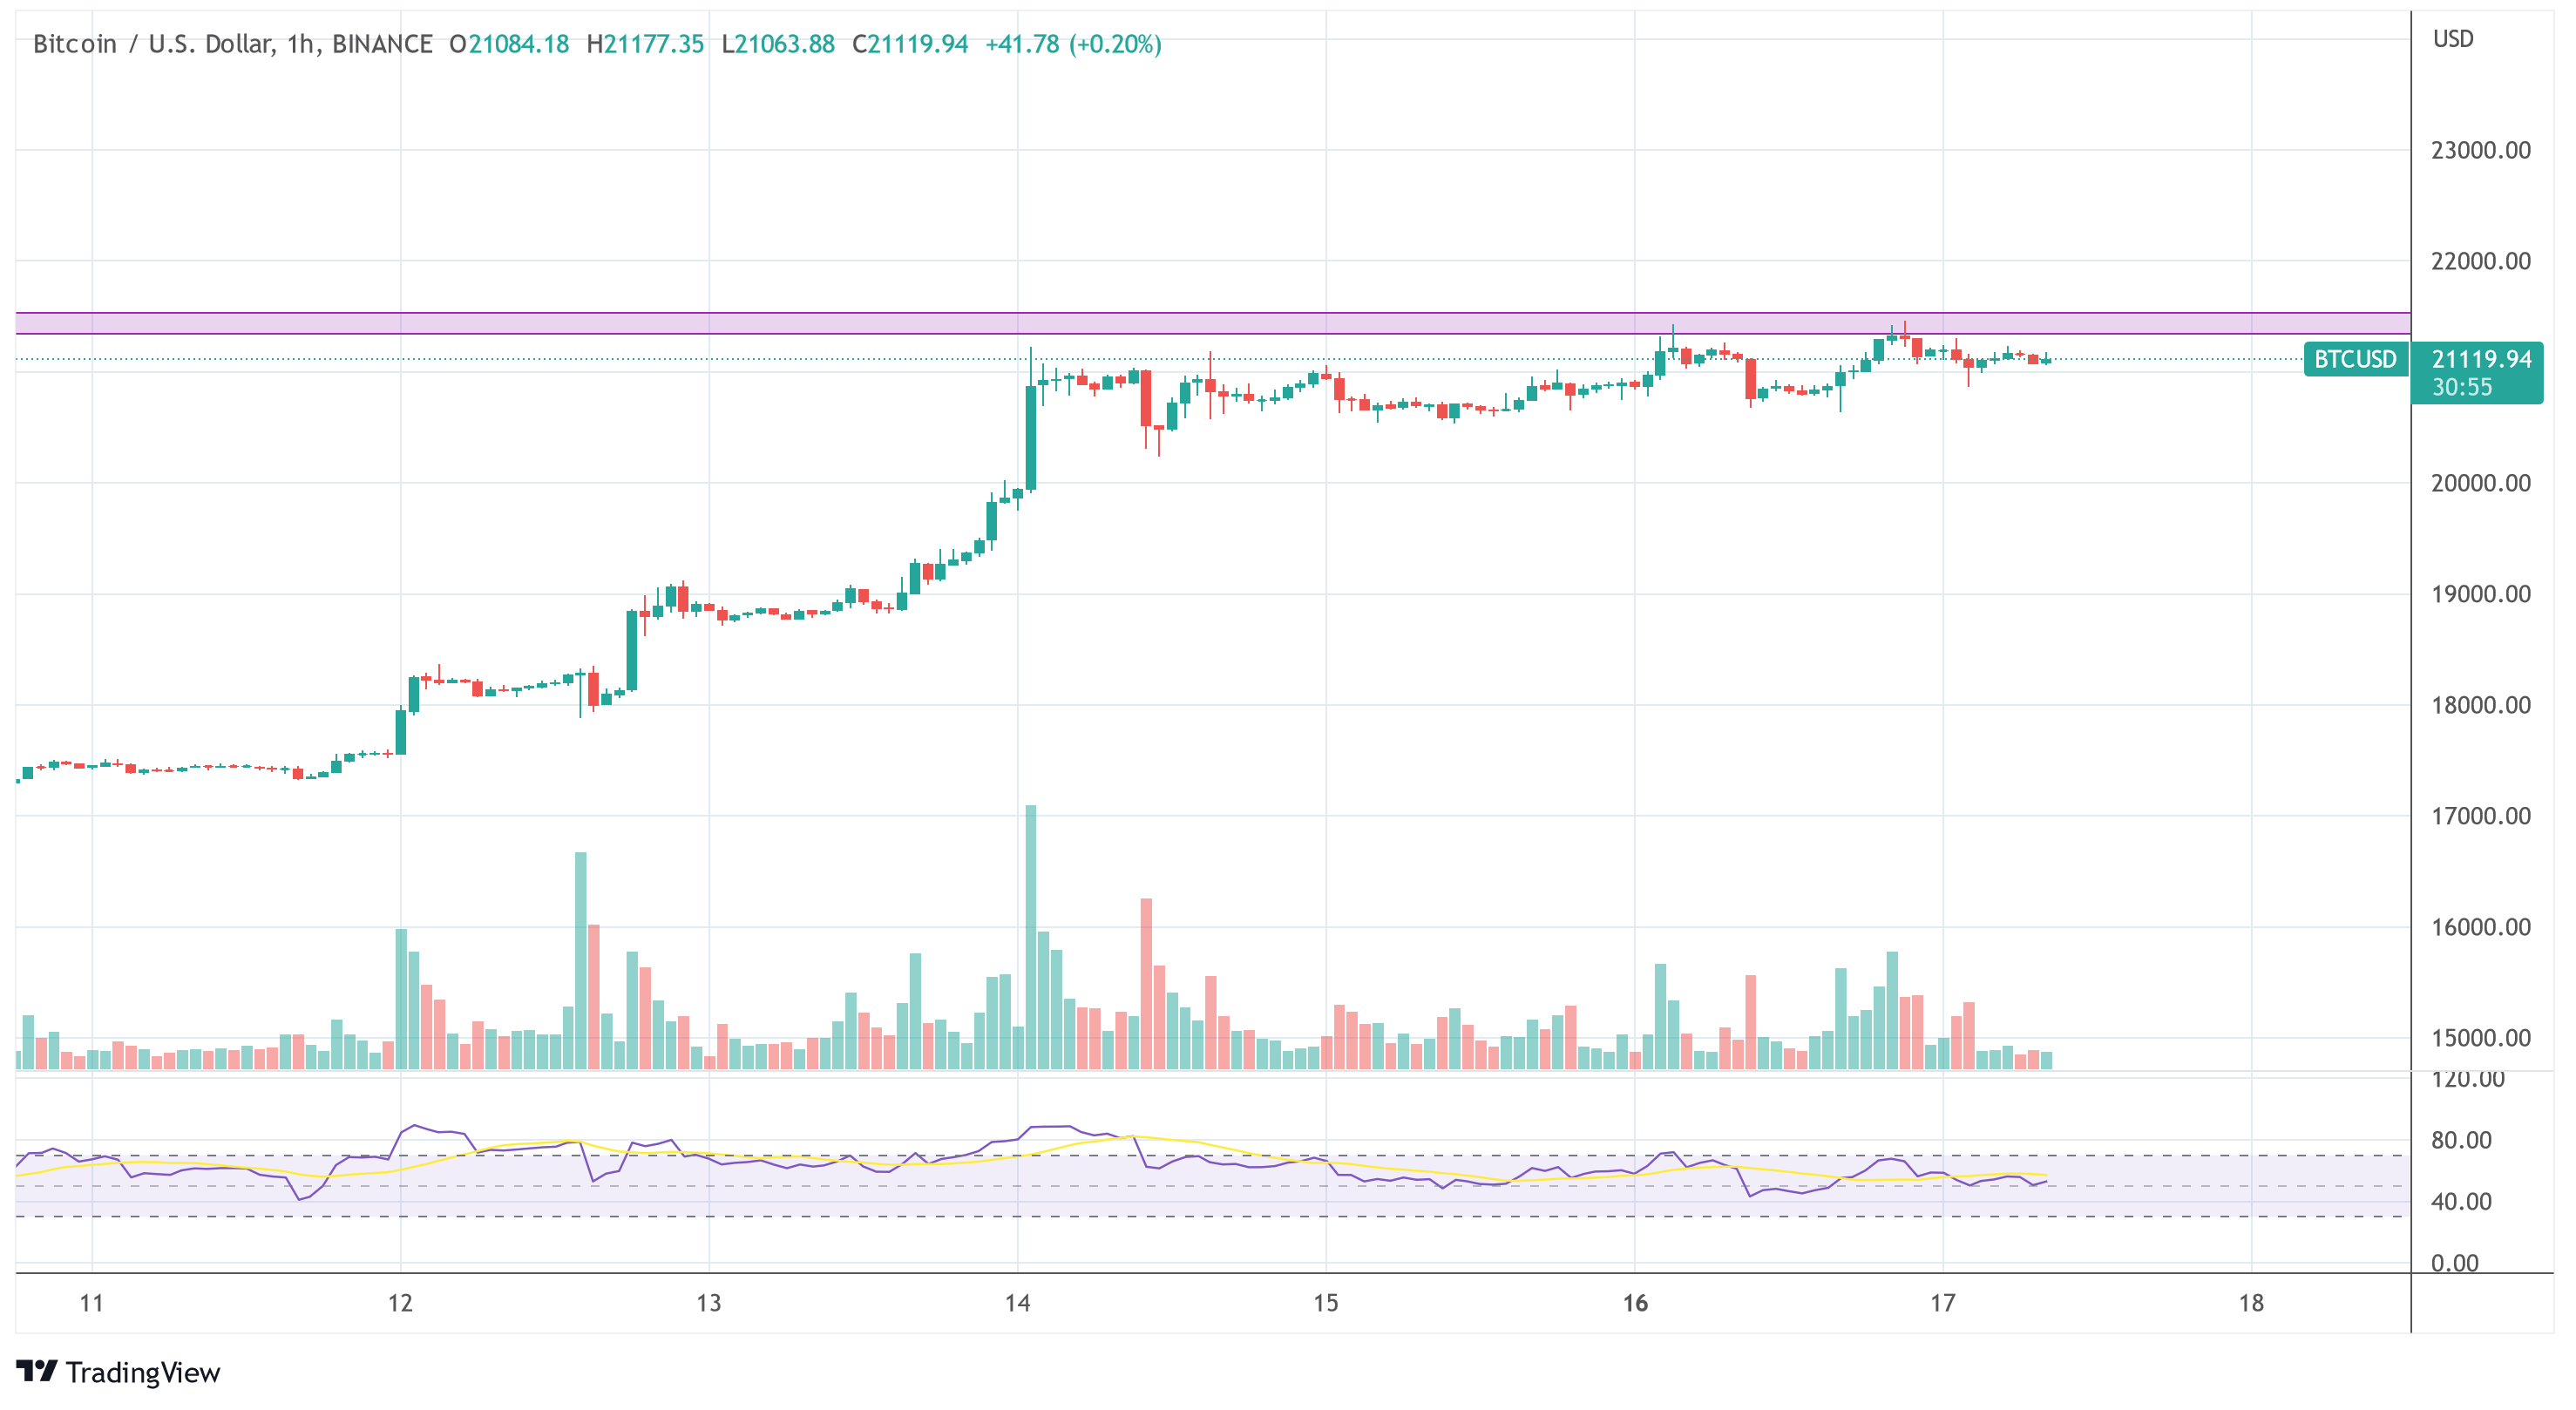
At press time, BTC stood at $21,119, leaving the price stuck below the daily resistance. A breakout above the $21,500 level would be crucial to build confidence in the rally and dispel the belief that the recent move might be a bull trap.

Featured image from Kanchanara / Unsplash, Chart from TradingView.com