
Bitcoin has faced one of its most volatile weeks in recent history, plunging to $103,000 on Friday in a dramatic 15% drop that erased billions in market value within hours. The sudden sell-off triggered widespread liquidations across the crypto market, wiping out leveraged positions and sparking panic among traders. However, price action is now showing early signs of recovery, with some analysts suggesting that this sharp correction could pave the way for a stronger, more sustainable uptrend.
According to a recent report from CryptoQuant, this event marks one of the most severe market resets ever recorded, with potential ripple effects expected to shape price behavior for months to come. Following Bitcoin’s peak last week, open interest — a measure of futures market activity — dropped sharply by $12 billion, from $47 billion to $35 billion. This represents one of the largest contractions in derivatives positioning seen in recent years.
Such massive deleveraging historically precedes a healthier market structure, as excessive speculation is flushed out. While volatility remains elevated, the combination of reduced leverage and renewed inflows from stablecoin reserves could position Bitcoin for a gradual recovery — if demand holds steady and buyers regain confidence in the coming sessions.
Market Reset Clears the Path For Bitcoin
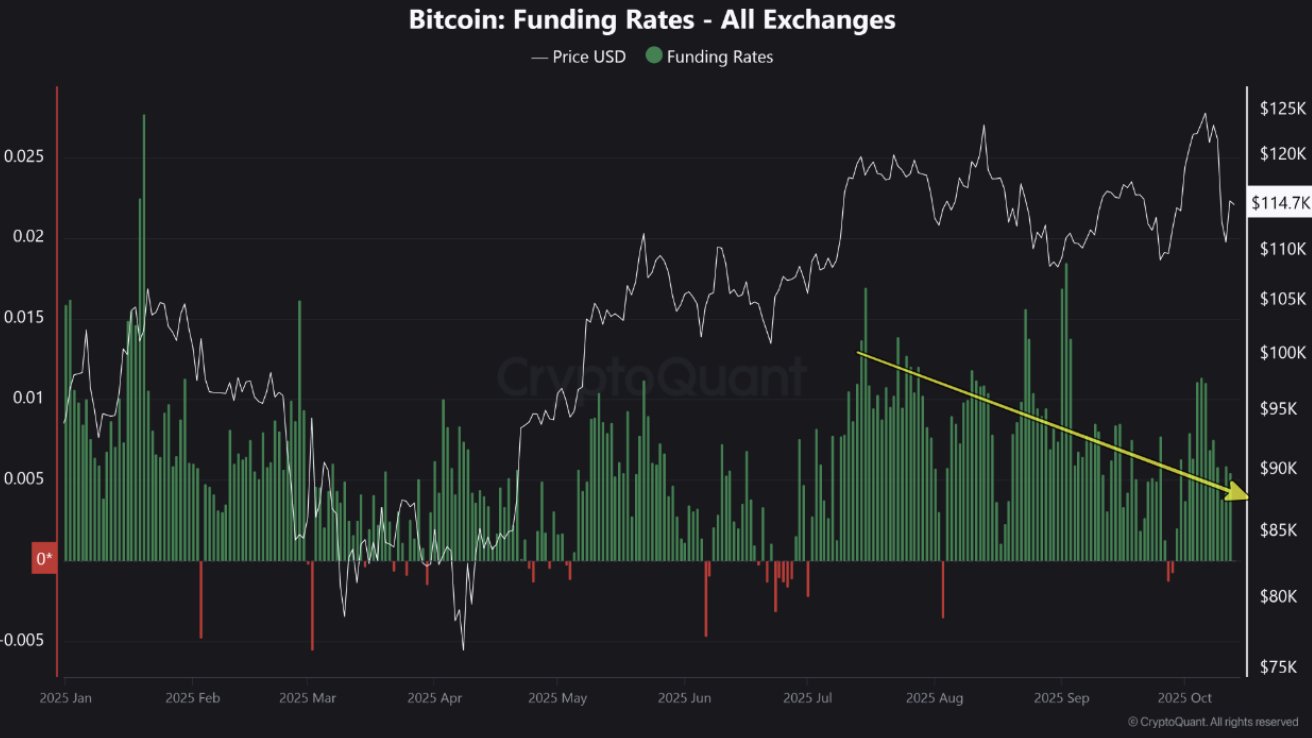
The CryptoQuant report highlights a notable shift in Bitcoin’s market structure following Friday’s massive correction. Funding rates, which had been declining steadily for months, briefly turned negative during the capitulation event — a clear sign that traders flipped bearish in panic. However, these rates have since normalized to modestly positive levels, indicating that sentiment is stabilizing and short-term speculation is being replaced by more balanced positioning.

Another key metric, the Bitcoin Estimated Leverage Ratio (ELR), also dropped significantly after reaching levels not seen since 2022. This sharp reduction points to a widespread deleveraging across derivatives markets, as overexposed traders were forced to unwind positions. Such events often act as a “reset” for market health, flushing out excessive leverage and setting the stage for more sustainable growth.
Meanwhile, the Bitcoin Stablecoin Supply Ratio (SSR) fell to its lowest point since April. This decline implies that stablecoin liquidity — or the potential buying power sitting on the sidelines — has risen substantially relative to Bitcoin’s market capitalization. Historically, when stablecoin liquidity increases after major sell-offs, it often signals an accumulation phase that precedes recovery.
BTC Attempts Recovery After Sharp Correction
Bitcoin is showing signs of stabilization after its steep decline to the $103,000 level on Friday. The daily chart reveals that BTC has rebounded sharply, currently hovering around $115,000. This recovery suggests that buyers are stepping in around key demand zones, defending the 200-day moving average — a historically critical level for maintaining long-term bullish momentum.


Despite the bounce, Bitcoin remains below the $117,500 resistance, a level that previously acted as strong support. Bulls must reclaim and close above this zone to confirm a continuation toward $120,000 and potentially retest the $125,000 range. Until then, the price remains within a consolidation phase following an extreme liquidation event.
The moving averages (50-day and 100-day) show a near-term bearish crossover risk, reflecting the market’s cautious tone. However, the quick rebound from last week’s capitulation indicates strong underlying demand and the potential for a higher low formation — a constructive technical sign.
If BTC manages to hold above $112,000 and regain $117,500, momentum could shift back in favor of buyers. Conversely, failure to sustain these levels could expose the market to another retest of lower supports around $108,000.
Featured image from ChatGPT, chart from TradingView.com