

- Bitcoin is currently in the process of breaking out of its trading range between $9,000 and $9,300
- The crypto is now showing some signs of strength following yesterday’s harsh rejection at $9,350 that sent it reeling to $9,100
- If BTC buyers can perpetuate this upwards momentum, one analyst is now noting that $9,850 is in the cards
- He also believes that it will face a rejection at this price level, which could confirm a massive head and shoulders (H&S) pattern
- If confirmed, this pattern alone could spark the next Bitcoin bear market
Bitcoin is about to break out of its trading range, with buyers currently battling with sellers as it hovers just above $9,300.
The crypto has been trading here throughout the past several hours, and it remains unclear as to whether or not bulls have enough strength to catalyze a decisive move higher.
Despite the current indecision, some analysts are noting that Bitcoin will soon make a massive movement that offers significant insight into its mid-term outlook.
This movement may favor bears, as one pattern that is currently in play could soon mark a macro top for Bitcoin and the entire cryptocurrency market.
Bitcoin Continues Consolidating as Analysts Watch for a Massive Movement
At the time of writing, Bitcoin is trading up marginally at its current price of $9,310. This is around where it has been trading throughout the past several days and weeks.
This is a significant level, as it marks the upper boundary of the trading range that it has been caught within for the past several weeks.
As of late, every attempt to move beyond this range has been met with an influx of selling pressure.
As Bitcoinist reported yesterday, investors may soon have a better idea of Bitcoin’s macro trend.
One analyst cited within the report explained that historical data suggests bouts of volatility this low are typically followed by $3,000+ movements.
BTC Forms Bearish H&S Pattern; Here’s How It May Be Confirmed
Bitcoin is somewhat neutral at the present moment, but there is one pattern currently in play that may not bode well for the cryptocurrency’s buyers.
One analyst pointed to a head and shoulders pattern that has been forming, noting that a rejection at $9,850 would confirm its validity.
“Haven’t been posting much on twitter lately, but I’ve been busy trading highly volatile alts. I barely look at the BTC chart, but given how the alt charts are looking, I could see a pop on Bitcoin to $9850, which might be the short for the whole market.”
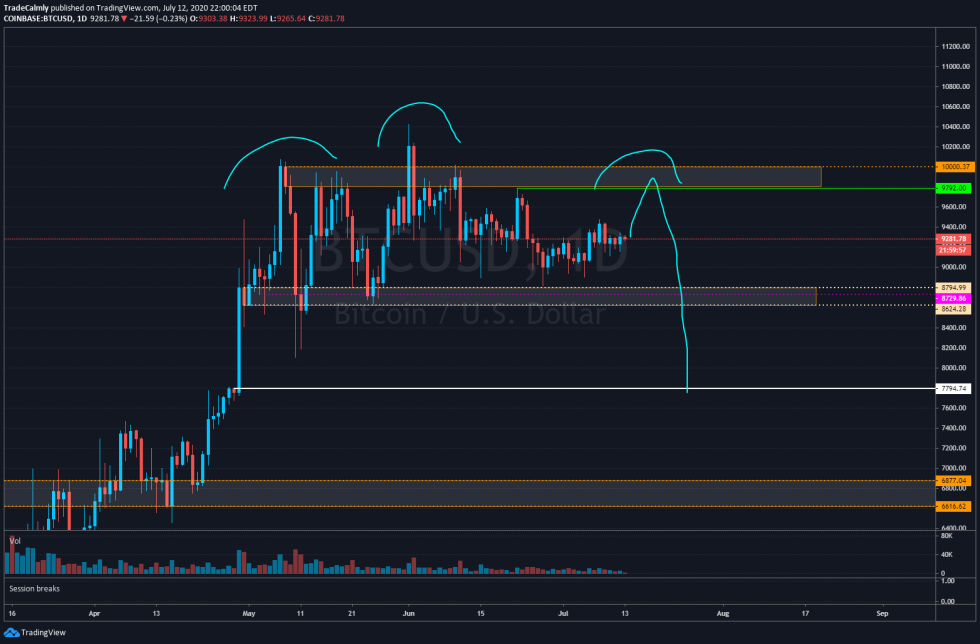

Image Courtesy of Calmly. Chart via TradingView.
If this pattern turns out to be valid, it could set the tone for how Bitcoin trends in the months ahead.
Featured image from Unsplash.
Charts from TradingView.