

Bitcoin bulls could be gearing up to charge significantly higher, according to a high timeframe momentum measuring tool.
The technical indicator has just inched into bullish territory, and if confirmed would make the third time in the top cryptocurrency’s history that such a signal fired from bear market lows. It could suggest a major momentum change and set off a stampede across the crypto market.
Forget Intraday Movements, Long-Term Trends Are Due To Change
Bitcoin price is bouncing back after a recent rejection above $30,000 and retest of $27,000. Currently trading at just below $28,300 only 48 hours later, it’s starting to seem like bulls are in charge.
After a long and painful crypto winter that took down FTX and much of the industry with it, the tide could be turning. This is evident in the 4W LMACD, which is crossing bullish for the first time since October 2021.
Even then, the LMACD ticked bullish for just one candle close, and ultimately failed to confirm. The result was a nasty downtrend in Bitcoin. This is also why BTCUSD needs to hold bullish for several candles at this point to confirm the bullish crossover.
If confirmed, it would be only the third instance happening from bear market lows around the zero line. There are other crossovers while well above the zero line, but were commonly fakeouts that led to downside.
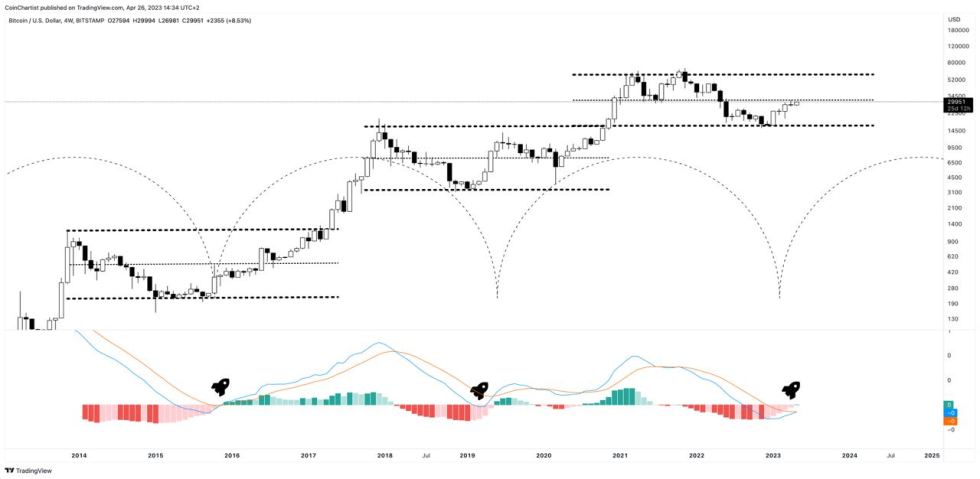

Is Bitcoin ready for a huge momentum change? | BTCUSD on TradingView.com
Why A Bitcoin Bullish Crossover Could Mean Crypto Winter Is Over
If Bitcoin bulls can hold current levels for the next four weeks, the 4W will close with a bullish crossover of the LMACD. The LMACD is the logarithmic version of the Moving Average Convergence Divergence indicator.
It displays momentum changes relative to longer term price movements more clearly, versus its linear-based counterpart. Simply put, it is becoming increasingly clear that momentum is changing.
The LMACD like the MACD is a lagging indicator. Although the crossover of the LMACD line through the signal line from below is a buy signal, the real trend change would have already happened several candles ago, as bearish momentum began to weaken.
In the past, a confirmed bullish crossover of the tool from around the zero line resulted in a massive rally. The first of which resulted in more than 5,000% ROI. The second saw more than 1,800% ROI. What will this latest crossover bring for results?
The 4W #Bitcoin LMACD has just crossed bullish for the first time since October 2021
Near cyclical perfection and at mid-range. Top of the range is next. pic.twitter.com/uy4nWOG0aV
— Tony Severino, CMT (@TonySeverinoCMT) April 26, 2023