

On-chain data shows Bitcoin netflows have increasingly become negative since the crash, meaning investors have been buying the dip.
Bitcoin Netflows Becoming More Negative Since The Crash
As pointed out by an analyst in a CryptoQuant post, BTC netflows have started to turn more negative since the crash a few days back.
The “all exchanges netflow” is an indicator that measures the net amount of Bitcoin entering or exiting wallets of all exchanges. The metric’s value is simply calculated as the difference between the inflows and the outflows.
When the value of the indicator is positive, it means there are currently more inflows than the outflows. Such values imply that investors are transferring a net amount of coins to exchanges, possibly for selling purposes.
Therefore, positive netflow values can prove to be bearish for the price of Bitcoin as they lead to an increase in the selling supply of the coin.
On the other hand, positive values imply a net amount of coins are being withdrawn from exchanges. As holders usually transfer their BTC out of exchanges for hodling them, this trend can be bullish for the crypto.
Related Reading | Digging Into The Data Of Bitcoin Mining Decentralization
Now, here is a chart that shows the trend in the Bitcoin netflows over the last six months:


Looks like the value of the indicator has been going down recently | Source: CryptoQuant
As you can see in the above graph, the Bitcoin netflow has become increasingly negative over the past couple of weeks as the price of the crypto has crashed down.
This shows that investors have been buying the “dip” as they are transferring a net amount of coins out of exchanges.
Related Reading | NYC Mayor Will Keep His Promise And Convert First Paycheck To Bitcoin And Ethereum
As mentioned before, the supply on exchanges is often considered the “selling supply” of BTC. So, the trend of it reducing over the last few weeks might be bullish for the price in the long term.
BTC Price
At the time of writing, Bitcoin’s price floats around $36.5k, down 12% in the last seven days. Over the past month, the crypto has lost 28% in value.
The below chart shows the trend in the price of BTC over the last five days.
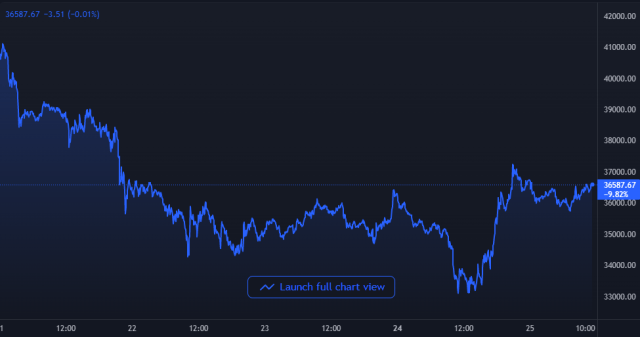

BTC's price has plunged down over the past week | Source: BTCUSD on TradingView
Yesterday, the price of Bitcoin crashed down to as low as $33k, before recovering back above the $36k level today.
At the moment, it’s unclear if the coin has bottomed or if more downside is coming. However, if the netflows are anything to go by, the mid to long term outlook may still be bullish.
Featured image from Unsplash.com, charts from TradingView.com, CryptoQuant.com