

On-chain data shows demand for Bitcoin has been returning recently, but the rise has been slower than what previous cycles saw at a similar stage.
Bitcoin Active Addresses Haven’t Grown Much Recently
As pointed out by an analyst in a CryptoQuant post, the market activity rapidly changed after the bottom formed during the previous cycles. The relevant indicator here is the “active addresses,” which measures the daily total amount of Bitcoin addresses that are participating in some transaction activity on the chain.
The metric only measures unique addresses, meaning that if an address takes part in multiple transfers in a single day, it’s still counted only once. The indicator also accounts for both senders and receivers in this measurement.
When the value of this metric is high, it means a large number of addresses are making transactions on the network right now. Such a trend suggests that the cryptocurrency is actively attracting users to trade on the chain currently.
On the other hand, low values imply not many users are making transfers on the blockchain at the moment. This kind of trend can suggest that demand for the asset is low currently.
Now, here is a chart that shows the trend in the Bitcoin active addresses over the last few years:


Looks like the value of the metric hasn't moved much in recent weeks | Source: CryptoQuant
As shown in the above graph, the Bitcoin active addresses had come down to a relatively low value during the bear market, but recently some improvement has been registered in the indicator.
In bear markets, the price is usually endlessly consolidating, so not many users find the coin that interesting to trade. During volatile moves, however, investors rush to trade, hence why the metric can show elevated values.
A recent example of activity suddenly coming back like this can be seen around the time of the FTX collapse in the chart. As the price began to move sideways again following the crash, the active addresses also once again sank down.
The metric has seen some increase with the latest rally in the price of Bitcoin, but the rise has still not been too significant. In comparison, the 2018-2019 cycle saw the activity rapidly going up following the bear market bottom formation.
The quant has also attached the annual active addresses detrended price oscillator (DPO) to better illustrate the difference between the current and the previous cycle. As is visible in the graph, the trend in the DPO is only showing early signs of the bear market exit so far in the current cycle.
“At this time, fears external to the network may be impacting full demand returns and delaying a sharper improvement in network fundamentals,” explains the analyst. “The understanding of a possible turbulent year in terms of macroeconomic conditions has not yet enabled a feeling of greater risk appetite and investors remain cautious.”
BTC Price
At the time of writing, Bitcoin is trading around $23,700, down 1% in the last week.
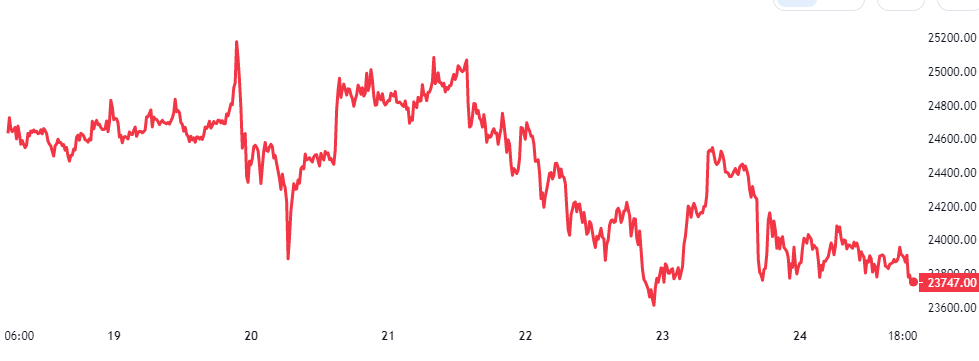

BTC has declined recently | Source: BTCUSD on TradingView