

Bitcoin price is still stuck in the mid-$30,000 range for weeks now, unable to break any lower or make an attempt to reclaim highs. After such a drastic 50% move down, the market is shaken and waiting for confirmation of direction before volume returns.
Currently, the top cryptocurrency by market cap is at historically oversold levels on a modified NVT signal, according to the tool’s original creator, Willy Woo.
Willy Woo Updates NVT Signal, Claims Crypto Reaches Historic Oversold Levels
All around the crypto market there are analysts ranging from phonies with photoshopped PnLs, to chartered market technicians and iconic trading legends.
Some are pseudonymous like Plan B, but it doesn’t detract from their overall contributions to the space. Another huge contributor has been Willy Woo, who doesn’t hide behind any persona, but presents some of the most compelling charts in the space.
Like Charles Edwards, another expert, Woo also works on creating crypto-specific tools and in the past designed the NVT ratio – the ratio of the total value of the Bitcoin network compared to the value being transacted across it.
The idea behind the formula is that when the price per coin reaches a higher ratio than what moves across the network, it is a sign a top is in. The opposite is true for a bottom, but for some time, Woo claimed the tool no longer worked.
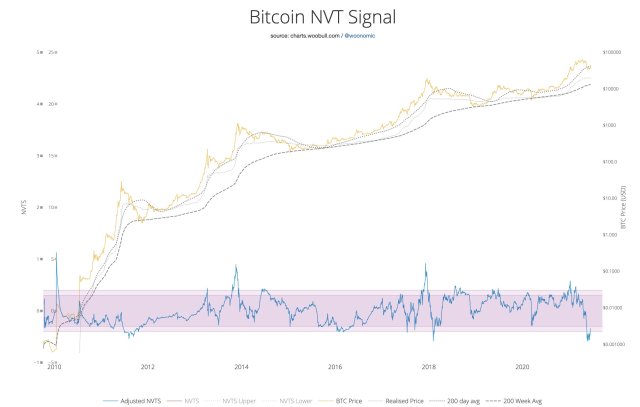

The modified NVT signal says BTC is historically oversold | Source: Charts.Woobull
Bitcoin NVT Signal Suggests Massive Bounce Could Be Incoming
However, now’s he’s got it figured out, tweaking the NVT signal to account for the total BTC on layer two technologies for a more accurate result. The tool after the tweaking Woo now suggests Bitcoin is at some of the most historically oversold levels, even despite the price tag of more than $30,000 per coin.
Related Reading | Low Volatility Bitcoin Suggests “Massive Upside Still Ahead”
Even the original signal which still exists on technical analysis platform TradingView, shows that Bitcoin has fallen back toward a level that has typically resulted in a long term bottom.
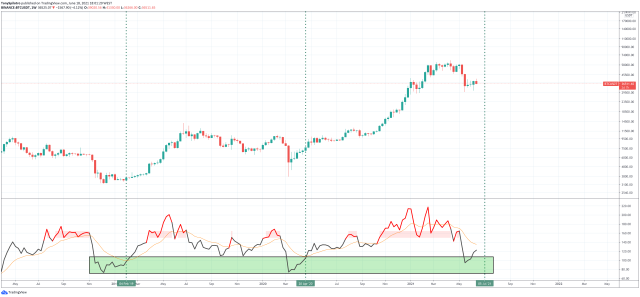

The OG signal says something similar yet less pronounced | Source: BTCUSD on TradingView.com
Crossing through the orange signal line results in some of the strongest uptrends in years, and that could be what’s to come if the cryptocurrency can prevent further downside and stage a recovery.
Related Reading | Classical Chartered Market Technician Warns Of Bitcoin “Bear Trap”
Reaching the red zone at highs has worked like a charm, why wouldn’t the same work in the inverse? If the tool is being read correctly as Woo explains, this suggests the cryptocurrency is oversold and a bounce is only a matter of time away.
Featured image from iStockPhoto, Charts from TradingView.com