

Data shows the Bitcoin 7-day volatility is now at lows not seen in 2.5 years as boring price movement continues.
Bitcoin 7-Day Volatility Now Sits At A Value Of Just 0.7%
According to the latest weekly report from Arcane Research, the BTC volatility has sharply declined recently. The “volatility” here is a metric that measures the deviation in the daily returns for Bitcoin from the average over a specified period. This rolling average period can be of any length, but the most useful versions of the metric are the ones taken over 7 days and 30 days.
When the value of the indicator is high, it means BTC is currently observing large fluctuations compared to the average recently. On the other hand, low values suggest the price of the crypto hasn’t been showing many returns in recent days. Naturally, trading during highly volatile periods involves more risk than in ones with stale price action.
Now, here is a chart that shows the trend in the 7-day and 30-day Bitcoin volatilities over the past year:
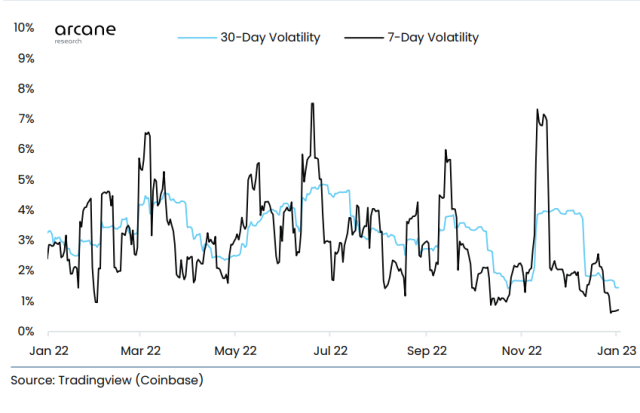

The values of the two metrics seem to have declined recently | Source: Arcane Research's Ahead of the Curve - January 3
As displayed in the above graph, both the weekly and monthly Bitcoin volatilities have sharply declined in the last few weeks as the crypto’s price has been stuck in endless consolidation. The 7-day version of the metric currently has a value of 0.7%, the lowest observed since July 2020, two and a half years ago.
Aside from this instance, the current low was only last seen way back in February 2019, during the late stages of the bear market in the previous BTC cycle. As for the 30-day volatility, this indicator has a value of 1.4% at the moment, a low level that was last seen right before the FTX collapse took place in November 2022.
The report notes that the monthly volatility has only been lower than this during seven instances since February 2019, which is only about 0.5% of the days between then and now, showing how rare a boring price action of this level is.
However, there could also be a positive outcome for the metric from these low levels, if history is anything to go on. “These low volatility periods rarely last for long, and volatility compression periods have previously tended to be followed by sharp moves, even in stagnant markets,” explains Arcane Research.
Though, if a sharp move does come out of this stale period, it could be in either direction, meaning that Bitcoin may even see another large downward move instead.
BTC Price
At the time of writing, Bitcoin’s price floats around $16,800, up 1% in the last week.
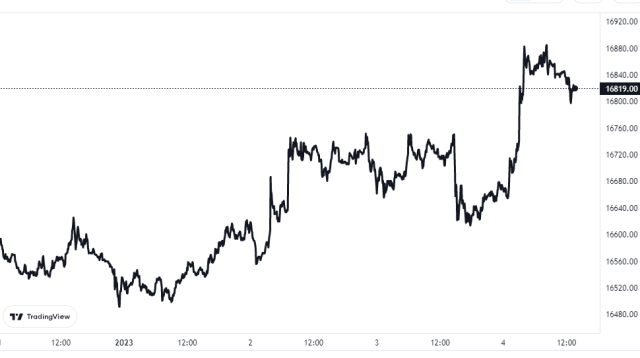

Looks like BTC has seen some rise in the last few days | Source: BTCUSD on TradingView