

Bitcoin price is back in the mid-$50,000 range, after several rejections from resistance at above $60,000 per coin. A visit to support levels to test demand much lower might soon become a reality now that a technical indicator measuring momentum has flipped bearish for the first time since 2020.
Here’s what this could mean for the leading cryptocurrency by market cap’s current bull run.
Bitcoin Momentum Turns Bearish For First Time Since Late 2020
When Bitcoin broke above $13,000 and set a higher high for the first time beyond the 2019 peak, momentum carried the cryptocurrency tens of thousands of dollars higher. At the current peak, each BTC was selling for a high of just below $62,000 but after repeated failed attempts to rally higher, that bullish momentum is beginning to fizzle out.
RELATED READING | A DECREASE IN BITCOIN WHALES SUGGESTS A BEAR MARKET IS DUE
The Moving Average Convergence Divergence indicator, while considered a lagging indicator, has begun to turn down on weekly timeframes for the first time since the big bullish breakout back in October 2020.
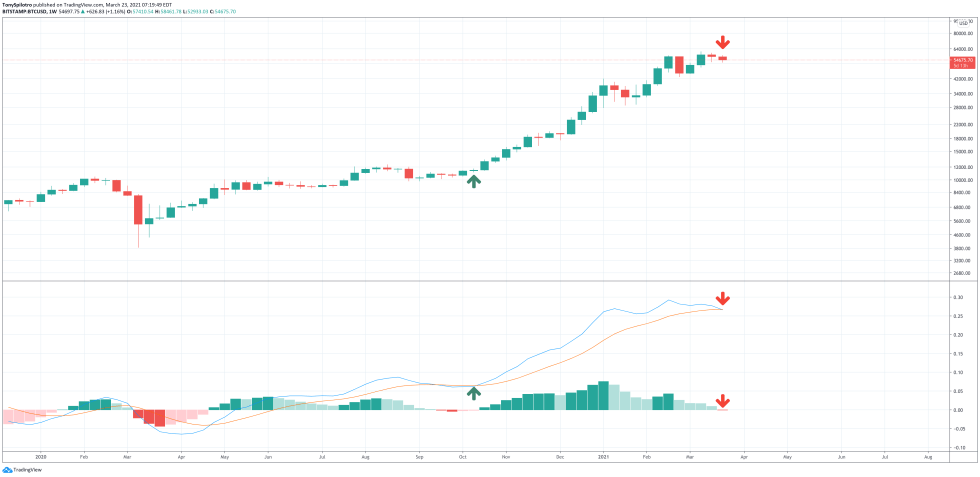

Bitcoin has crossed bearish on the weekly LMACD for the first time since the bullish breakout in October 2020 | Source: BTCUSD on TradingView.com
Both a bearish crossover of the two moving averages and the histogram flipping red suggests that momentum has begun to turn downward, and a correction is likely.
The signal is only valid if the weekly candle closes below around $54,500, in which the bearish crossover will be confirmed.
Lagging MACD Has Near-Perfect Track Record For Calling Crypto Tops
Bulls, however, still have several days left to uncross the currently bearish signal. If they don’t, bears could take over for weeks to come. Past bearish crossovers on weekly timeframes have marked mid-to-long term tops in the cryptocurrency market, including both the 2013 and 2017 bull market peaks.
RELATED READING | THIS ON-CHAIN METRIC SAYS BITCOIN RISK IS THE HIGHEST IN THREE YEARS
However, there was also such a crossover at the 2019 peak, which clearly wasn’t a long-term top leading to an extended bear market. That leaves the potential there for several twists and turns in the coming months, similar to the 2017 bull run.
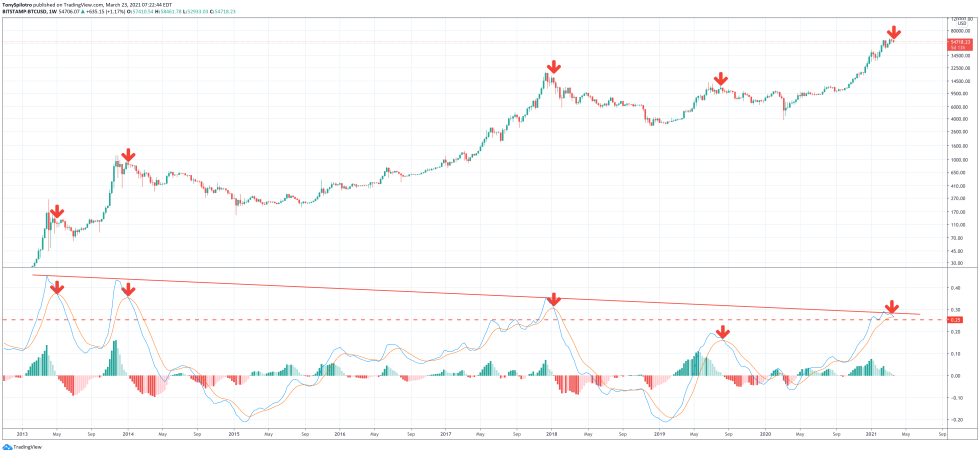

Past instances of flipping red on the weekly LMACD at such levels has resulted in a bear market | Source: BTCUSD on TradingView.com
The logarithmic MACD brushing up against a trendline where past cycles topped, however, doesn’t look promising for Bitcoin bulls.
Another scenario that cannot be ruled out, is Bitcoin breaking through the trendline, causing momentum to further soar to the upside. Such a scenario could provide the momentum necessary to take the leading cryptocurrency by market cap to prices of $100,000 and more per coin, which analyst across the finance industry are projecting.
Featured image from Deposit Photos, Charts from TradingView.com