

Over the last 7-10 days, a clash of bears and bulls has pushed Bitcoin inside a tightly-knit price range.
Traders are watching short-term technical barriers over long-term bullish fundamentals. The sentiment prompts Bitcoin to fluctuate inside a Triangle-like technical pattern, with its upper trendline behaving as resistance and the lower trendline acting as support. That is all the flagship cryptocurrency has offered: near-term long/short opportunities with no breakout attempts.
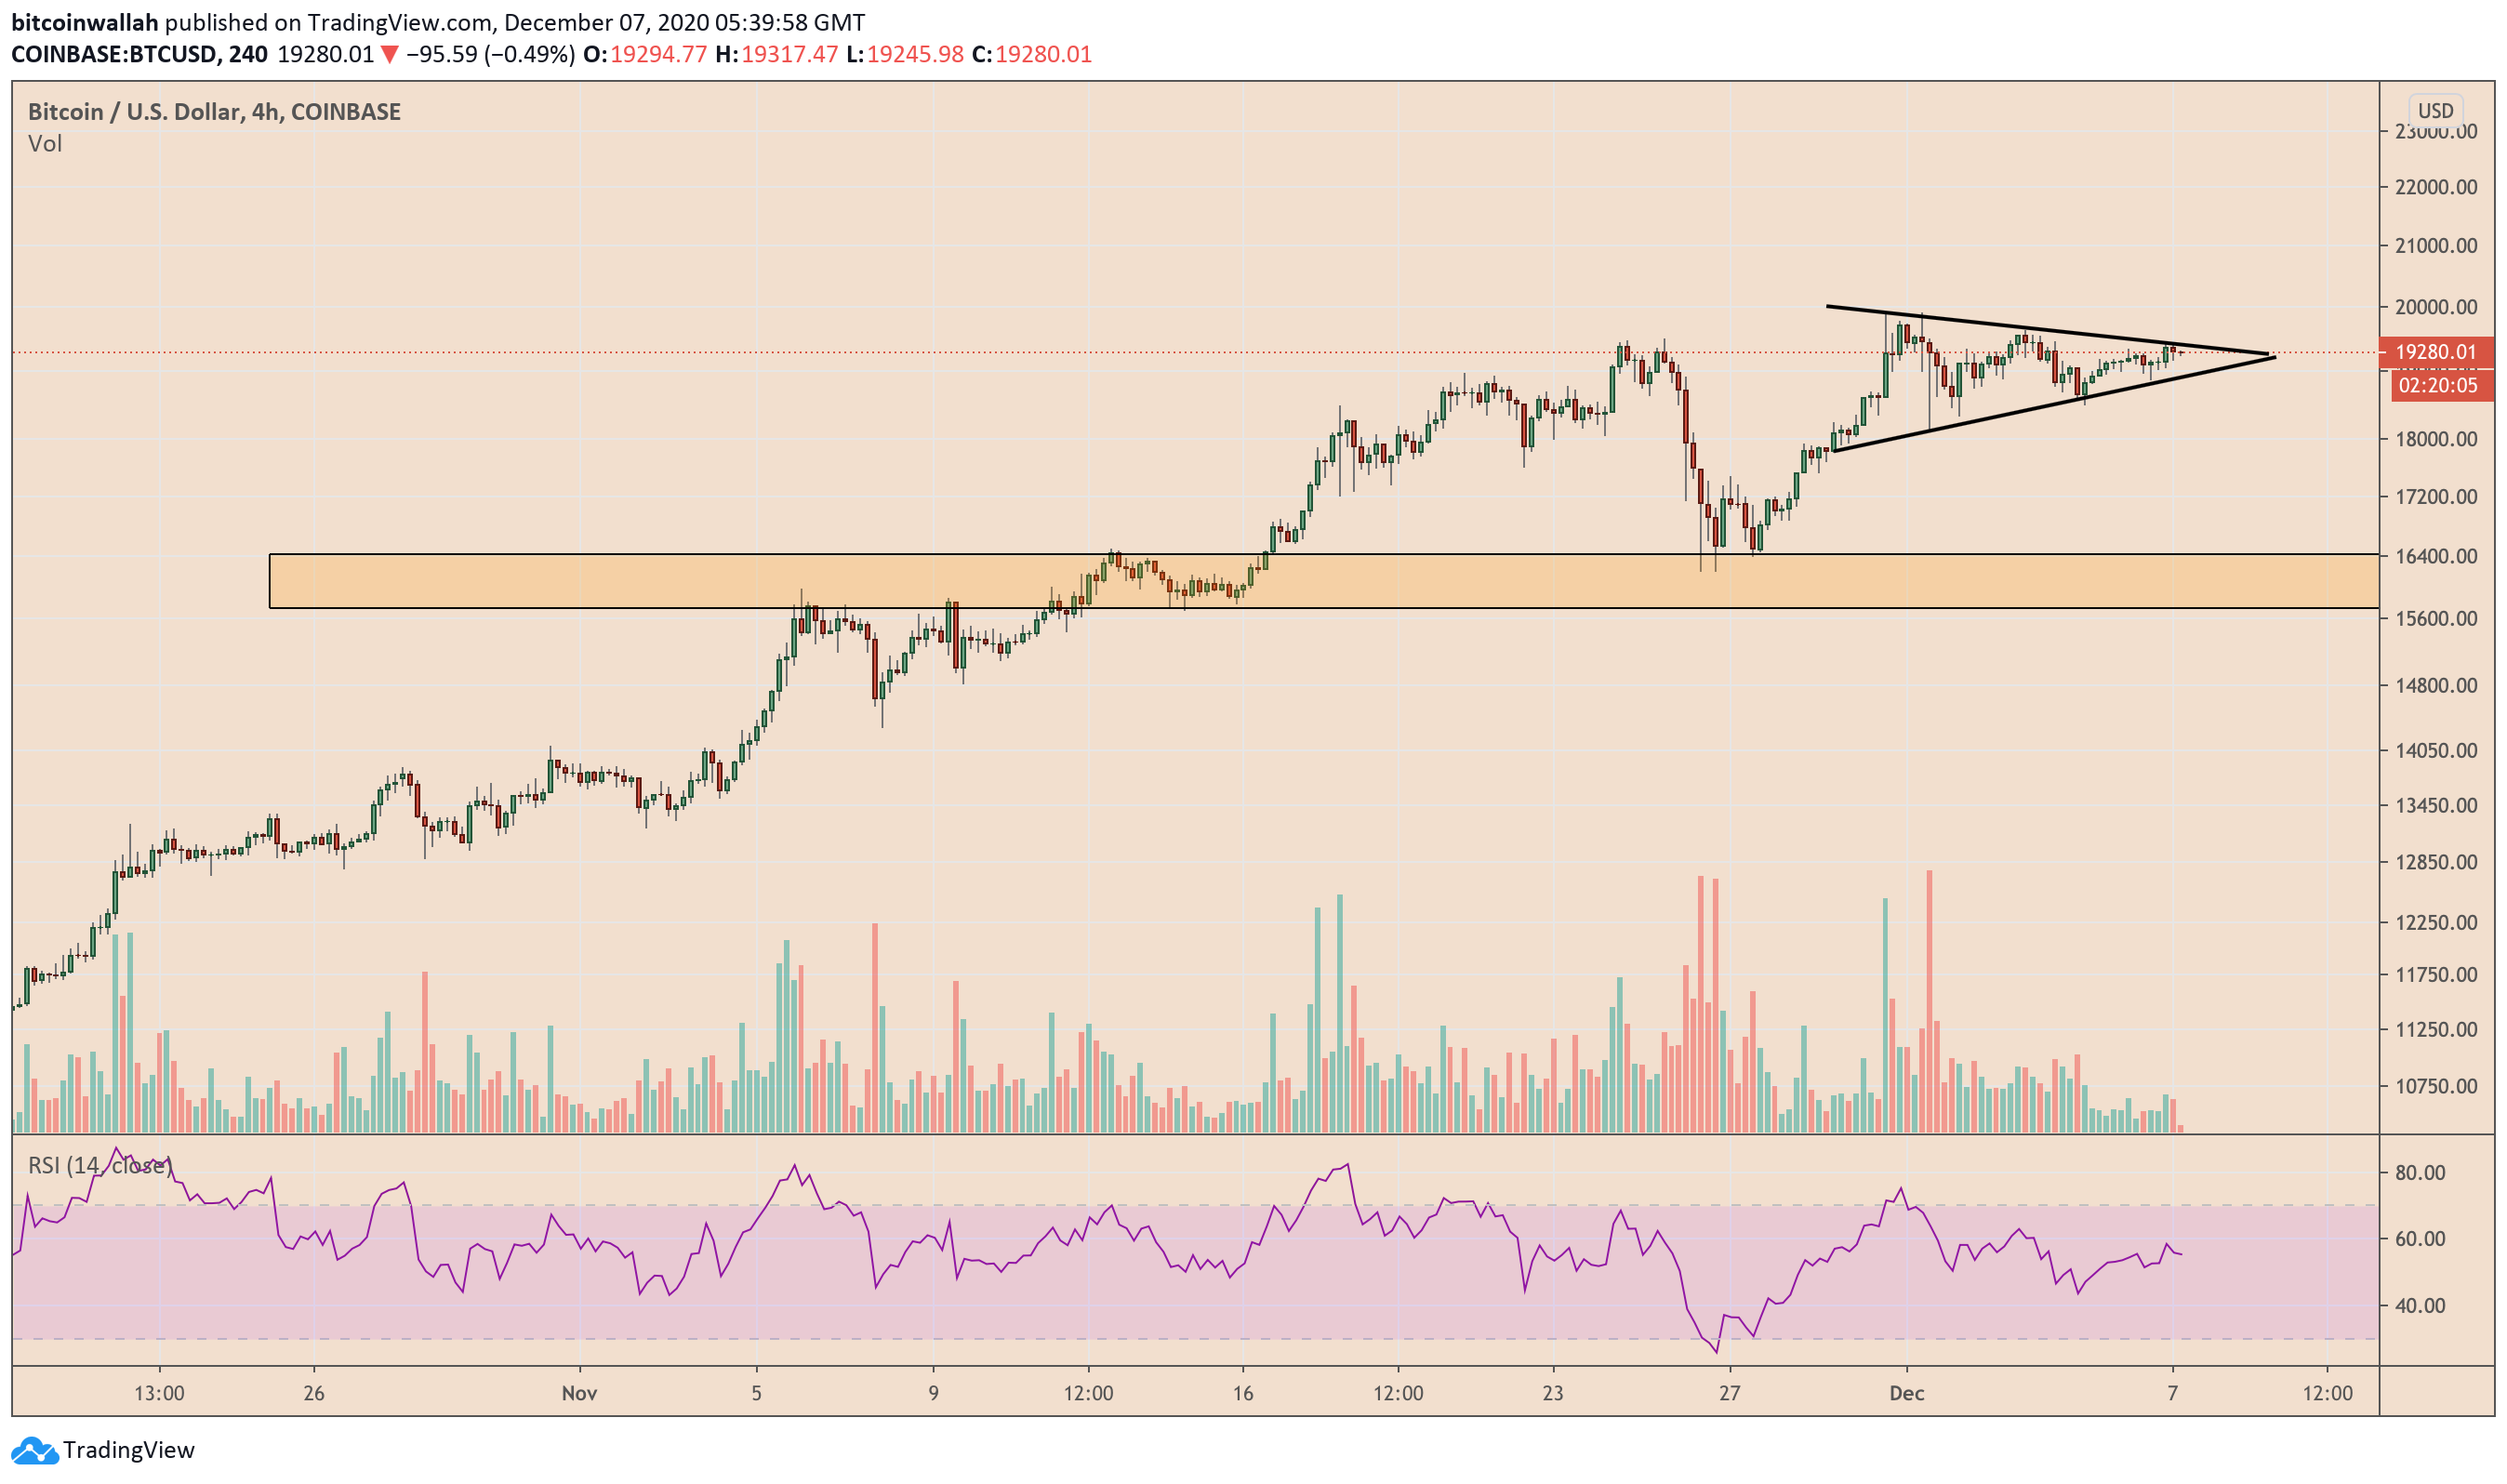
It appears safer for traders to take short-term calls instead of extending their bullish targets anywhere beyond Bitcoin’s recently-established all-time high of $19,915. Their previous attempts to do so resulted in stop-loss triggers, leading to billions of dollars worth of liquidations in the Bitcoin futures market.
The sentiment now continues in the new week. Bitcoin has formed a sequence of daily lower highs after topping out at $19,915. Meanwhile, bulls are holding $18,000 as their support. It is only a matter of time before one knows which level breaks first. The fundamentals may have the answer.
Bitcoin Macroeconomic Outlook
With COVID-19 vaccine development and distribution beginning, the US economy may recover gradually from the pandemic’s aftermath. Meanwhile, the US Congress could take more concrete decisions on their bipartisan efforts to launch the second stimulus package of $900 billion.
The Federal Reserve also meets next week to discuss whether or not to extend their infinite bond-buying policy from short-dated Treasurys to the ones with long-term maturities. In either case, the US central bank has ensured that it would keep buying the government and corporate debts and maintain its ultralow interest rates.
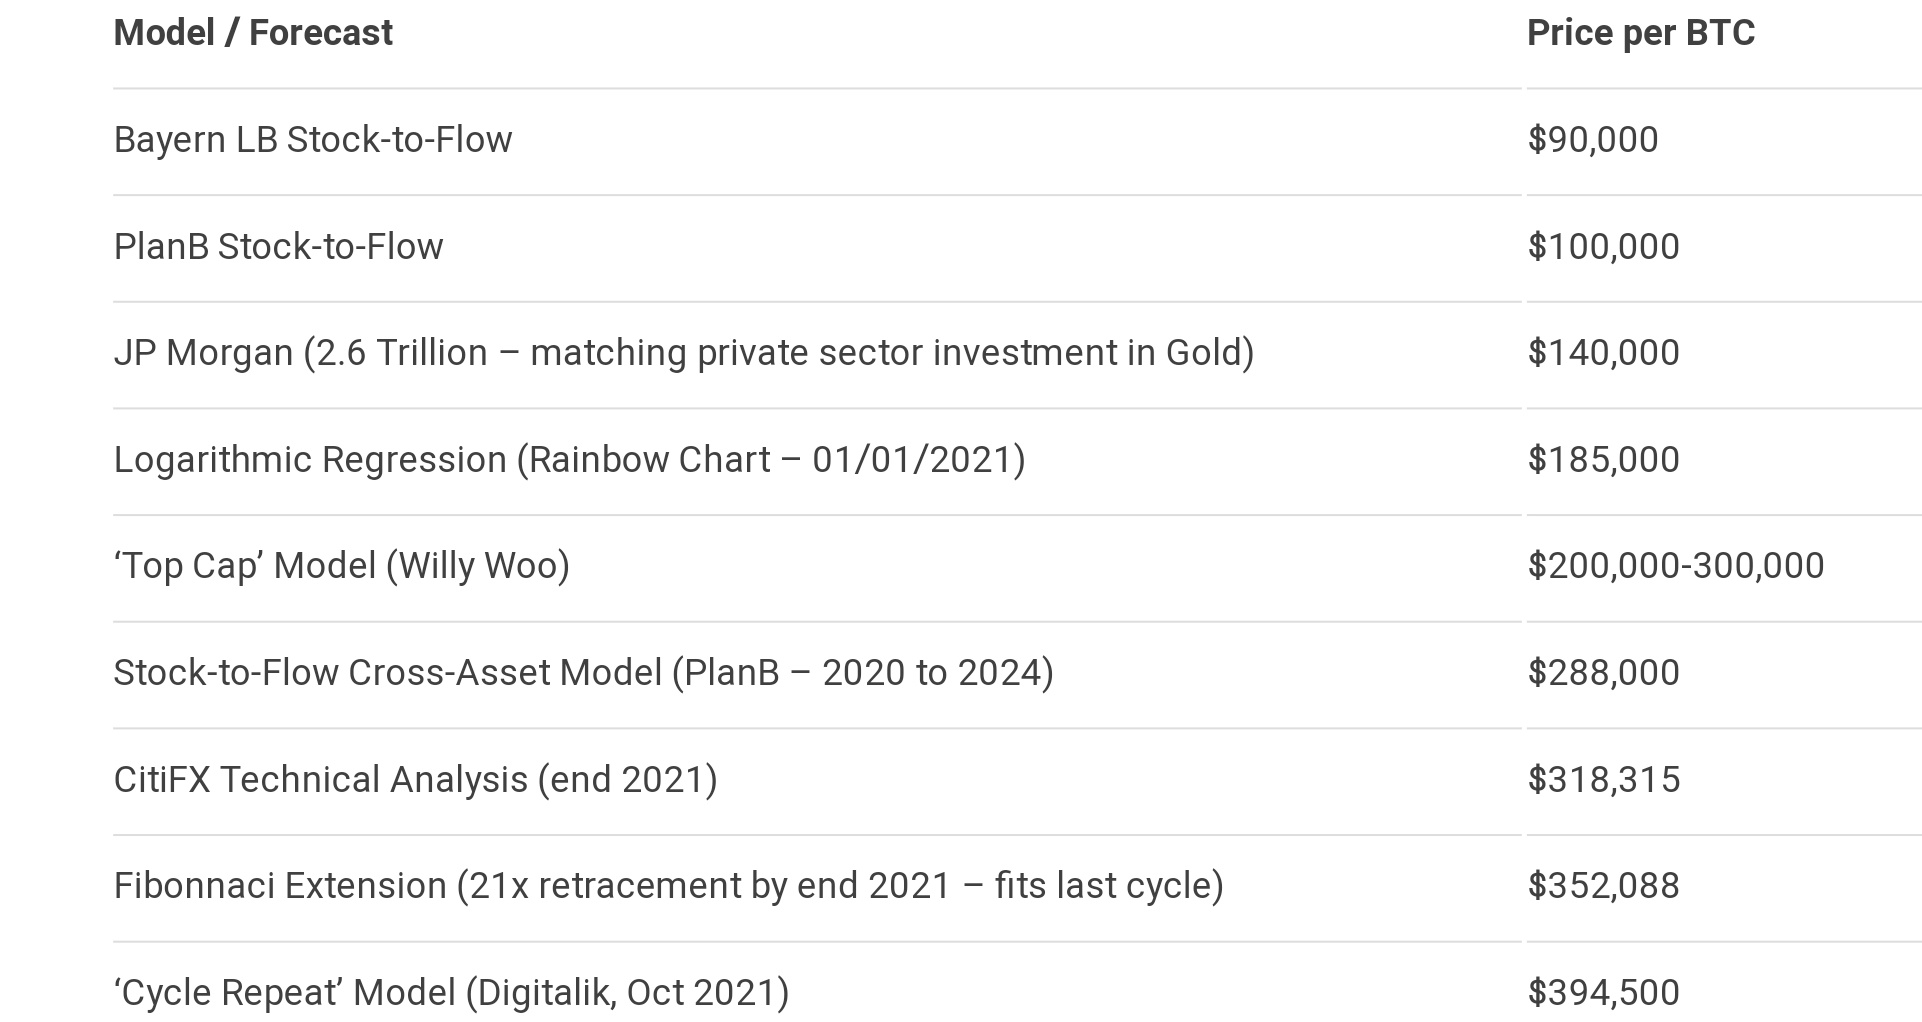
It is safer to assume that investors, not traders, will watch these developments even as the Bitcoin price falls below $18,000. A retail-led meltdown would give those with a long-term outlook an opportunity to buy the cryptocurrency cheaper, especially as more analogies predict its price to hit at least $90,000 amid an inflationary environment.
Unsupportive Technical Indicators
Bitcoin has opened the week in negative territory. It is modestly down by 0.43 percent but is trading above $19,200, confirming an intraday bias conflict. Nevertheless, technical indicators flash a sell-off warning that could push the price down towards $18,000 this week.

The TD Sequential Indicator completed its cycle after printing its ninth and final candlestick. It means the price may start a downside move in the form of red candlesticks. Moreover, the price on shorter timeframes is close to its upper resistance range, thereby profit-taking behavior among daytraders.
All and all, it appears unlikely for Bitcoin to continue its uptrend above $20,000 this week. Be prepared for surprises, nevertheless.