

- Bitcoin has been holding strong above $19,000, which is a positive sign for its short-term outlook
- The strength seen by the cryptocurrency as of late comes despite it seeing multiple strong rejections at its all-time highs
- The selling pressure laced throughout the mid-to-upper $19,000 region has been too much for bulls to handle
- However, buyers have been able to set a series of higher-lows following each rejection here, which is an incredibly bullish sign
- One trader is now pointing towards a few trends on its low-time frame chart as reasons why upside may be imminent
- There is one crucial level that the cryptocurrency needs to first break for it to see any serious gains in the days and weeks ahead
Bitcoin and the rest of the crypto market have been caught within a bout of consolidation as of late.
For BTC, this has favored bulls, as the cryptocurrency has been able to hold strong above $19,000 without facing any sustained rejections.
That said, it has yet to test the key resistance between $19,300 and $19,400, with the selling pressure here potentially being enough for the cryptocurrency to see some massive losses in the near-term.
One trader believes that a break above here could be imminent, noting a few factors that support this notion.
Bitcoin Shows Signs of Strength as Consolidation Continues
At the time of writing, Bitcoin is trading down just over 1% at its current price of $19,170. This marks a serious decline from the cryptocurrency’s all-time highs of $19,800 that have been tapped on a few occasions as of late.
The selling pressure here has sparked multiple intense rejections, but the fact that BTC is currently consolidating firmly above $19,000 is a positive sign that could work in bulls’ favor.
Trader Claims Bitcoin’s Low-Time Frame Chart Signals Upside is Imminent
While pointing to Bitcoin’s low-time frame chart, one trader explained that there are a few indications that a breakout is imminent.
He is looking towards $19,300 as a key level that must be surmounted, noting that bears will likely target $18,100 – should BTC see a breakdown.
“BTC / USD: LTF getting interesting as we squeeze against resistance with price continuously rising with this LTF trendline support, expecting this to break this week… Bulls need to flip $19,300 to continue bullish momentum, bears looking for drop to $18,100 on break down.”
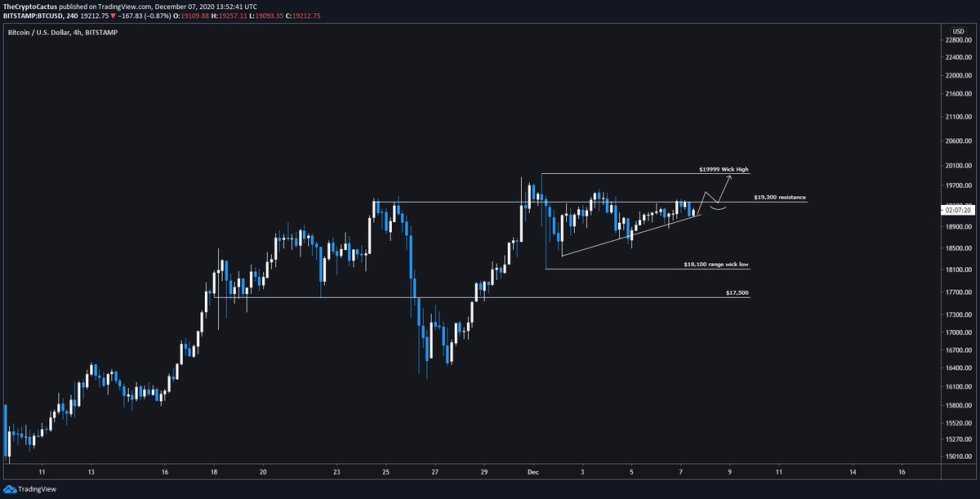

Image Courtesy of Cactus. Source: BTCUSD on TradingView.
How it responds to any imminent tests of this level should shine a light on bulls’ underlying strength.
Featured image from Unsplash.
Charts from TradingView.