

Bitcoin blasting above $50,000 per coin made it clear that the parabola would continue, marking the third major parabolic phase in the cryptocurrency’s short lifecycle. Commodities trader Peter Brandt has seen many price charts throughout his storied career.
This sort of behavior in an asset is rare, according to Brandt. But three times? That’s “historic,” he says. And according to a chart he’s shared, the parabola has a lot more to go before it is at risk of breaking down.
Bitcoin Makes History With Third “Extremely Rare” Parabolic Phase
Bitcoin was designed to near perfection as an economic ecosystem. The self-sustaining network lets users store and send BTC all without a third party intermediary. Miners power the network by providing hash rate, and for their time, costs, and efforts, they’re rewarded in coins.
RELATED READING | NO END IN SIGHT: RECORD-SETTING BITCOIN RALLY BREAKS PAST $50,000
Every four years, the reward Bitcoin miners receive is slashed in half, throwing off the delicate balance of supply versus demand enough to highly favor price appreciation. The impact of the first and even the second halving happened naturally, but this time around, investors banked on the third time being the charm.
Another parabolic uptrend has begun, marking the third time that Bitcoin has done so since its code was first released onto the internet. Lightning rarely strikes twice, and parabolic moves of this nature long-time trader Peter Brandt says are “extremely rare.” Happening twice is shocking, and three times, Brandt says, is downright “historic.”
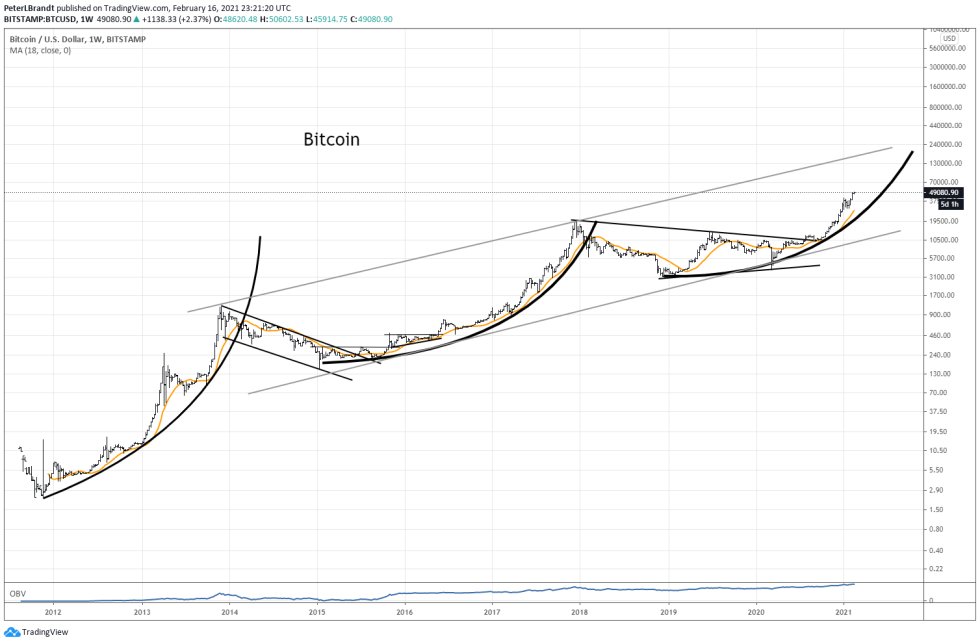

Peter Brandt says that parabola one time is “rare.” Three times is “historic.” | Source: BTCUSD on TradingView.com
Much More To Go Before The Top Is In, But Beware Of The Breakdown
Along with Brandt’s comments, the commodities trader and long time Bitcoin supporter also shared the chart above clearly defining each parabolic advance. The curve itself more closely matches the trajectory of the second cycle, while the cryptocurrency’s relationship with the moving average on the chart better matches the first post-halving bull market.
Brandt is considered a classical technical analyst, who relies on very few tools and the most basic of shapes and patterns. A channel the trader has drawn projects the top of the current parabolic phase to be much higher than current prices. That’s not to say that Bitcoin cannot correct back down to touch the moving average or the curve itself, it just suggests that the full extent of the move hasn’t yet been exhausted. Not even close in terms of dollars.
RELATED READING | BITCOIN HASN’T REACHED MANIA STAGE YET, ACCORDING TO THIS METRIC
Wherever Bitcoin tops, the fall is going to be devastatingly far this time around. A drop from $20,000 to $3,000 is crushing enough in terms of total percentage drawdown, but because – as Brandt points out and has been right about in the past – assets typically crash 80% or more when the parabola is finally violated, things will be exceptionally brutal.
An 80% fall from top projections around $200,000 to $300,000 would result in a loss per coin of $160,00 to $240,000 – taking Bitcoin back to, interestingly, this exact price point where support for the next bottom could be building.
Featured image from Deposit Photos, Charts from TradingView.com