
Bitcoin price is experiencing a pullback as this content is being typed. But after last night’s close in the DXY Dollar Currency Index, the top cryptocurrency could be cleared for liftoff.
The dollar lost a key level that in the past that led to some of the largest rallies in BTC history.
Correlations Between Crypto And Fiat Currency
Correlation is commonly found to some degree across almost all assets. It is rare that two assets show no correlation, and instead tend to exhibit strong and weak, positive and negative correlations.
Technical analysts or investors look at asset correlations for diversification purposes, and to reduce risk in a portfolio. For example, a crypto-heavy portfolio wouldn’t benefit much from adding tech stocks due to a strong correlation. It could even increase risk as an entire portfolio draws down at once.
Few assets are as negatively correlated as Bitcoin versus the dollar. This is because the most dominant trading pairs feature both BTC and USD. In the trading pair BTCUSD, BTC is the base currency, and USD is the quote currency.
This is precisely why the DXY Dollar Currency Index losing a key level could have a dramatic impact on the price per BTC.

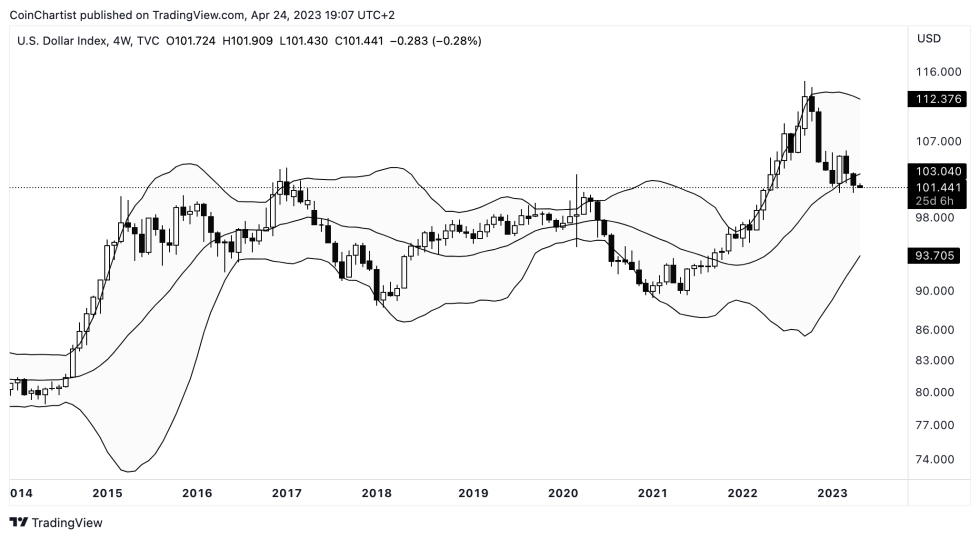
The dollar has lost the middle-Bollinger Band | DXY on TradingView.com
Why The Dollar Dropping Means Bitcoin Popping
The DXY Dollar Currency Index is a weighted basket of top currencies from around the globe. None of which are Bitcoin. However, there is no better measure of the strength of the dollar than the DXY.
In technical analysis, higher timeframes produce the most dominant signals. Not all timeframes are treated equally, so experimentation can provide early clues about what’s to come. For example, the 4-week timeframe trims just 2-3 days off each one-month interval. This timeframe yields slightly earlier signals than the monthly.
While the monthly DXY is resting upon the middle Bollinger Band, on the 4-week timeframe the level has already been lost. The last candle close finished below the 20-period SMA, which makes up the basis of the upper and lower bands.
How does this have anything to do with Bitcoin, you ask? When USD was strong in 2022, it crushed BTC on the trading pair. If the dollar is poised to plummet, then the BTC side of the trading pair should soar again. In fact, each time the DXY lost this level, BTCUSD had one of its largest rallies of the past decade.
The $DXY opened its 4W candle below the mid-BB.
After a close, it commonly moves to the lower Bollinger Band.
Each time this happened, resulted in the biggest, most bullish moves in #Bitcoin over the last decade.
But yeah, no new ATHs this year because halving 🙄 pic.twitter.com/i7X0FsfjYN
— Tony Severino, CMT (@TonySeverinoCMT) April 24, 2023