Ethereum’s relative performance against Bitcoin is back under pressure. In a June 20 X post, Woetoe said the ETH/BTC ratio is at 0.027, bringing it back to early-2023 levels. The analyst contrasted that with the 2021 peak around 0.088 and asked whether ETH is now a contrarian bet or facing structural decline.
That question captures the core debate around Ethereum right now. A low ETH/BTC ratio can look attractive to investors who believe Ethereum will eventually regain leadership. It can also be a warning that capital continues to prefer Bitcoin over the broader smart-contract ecosystem.
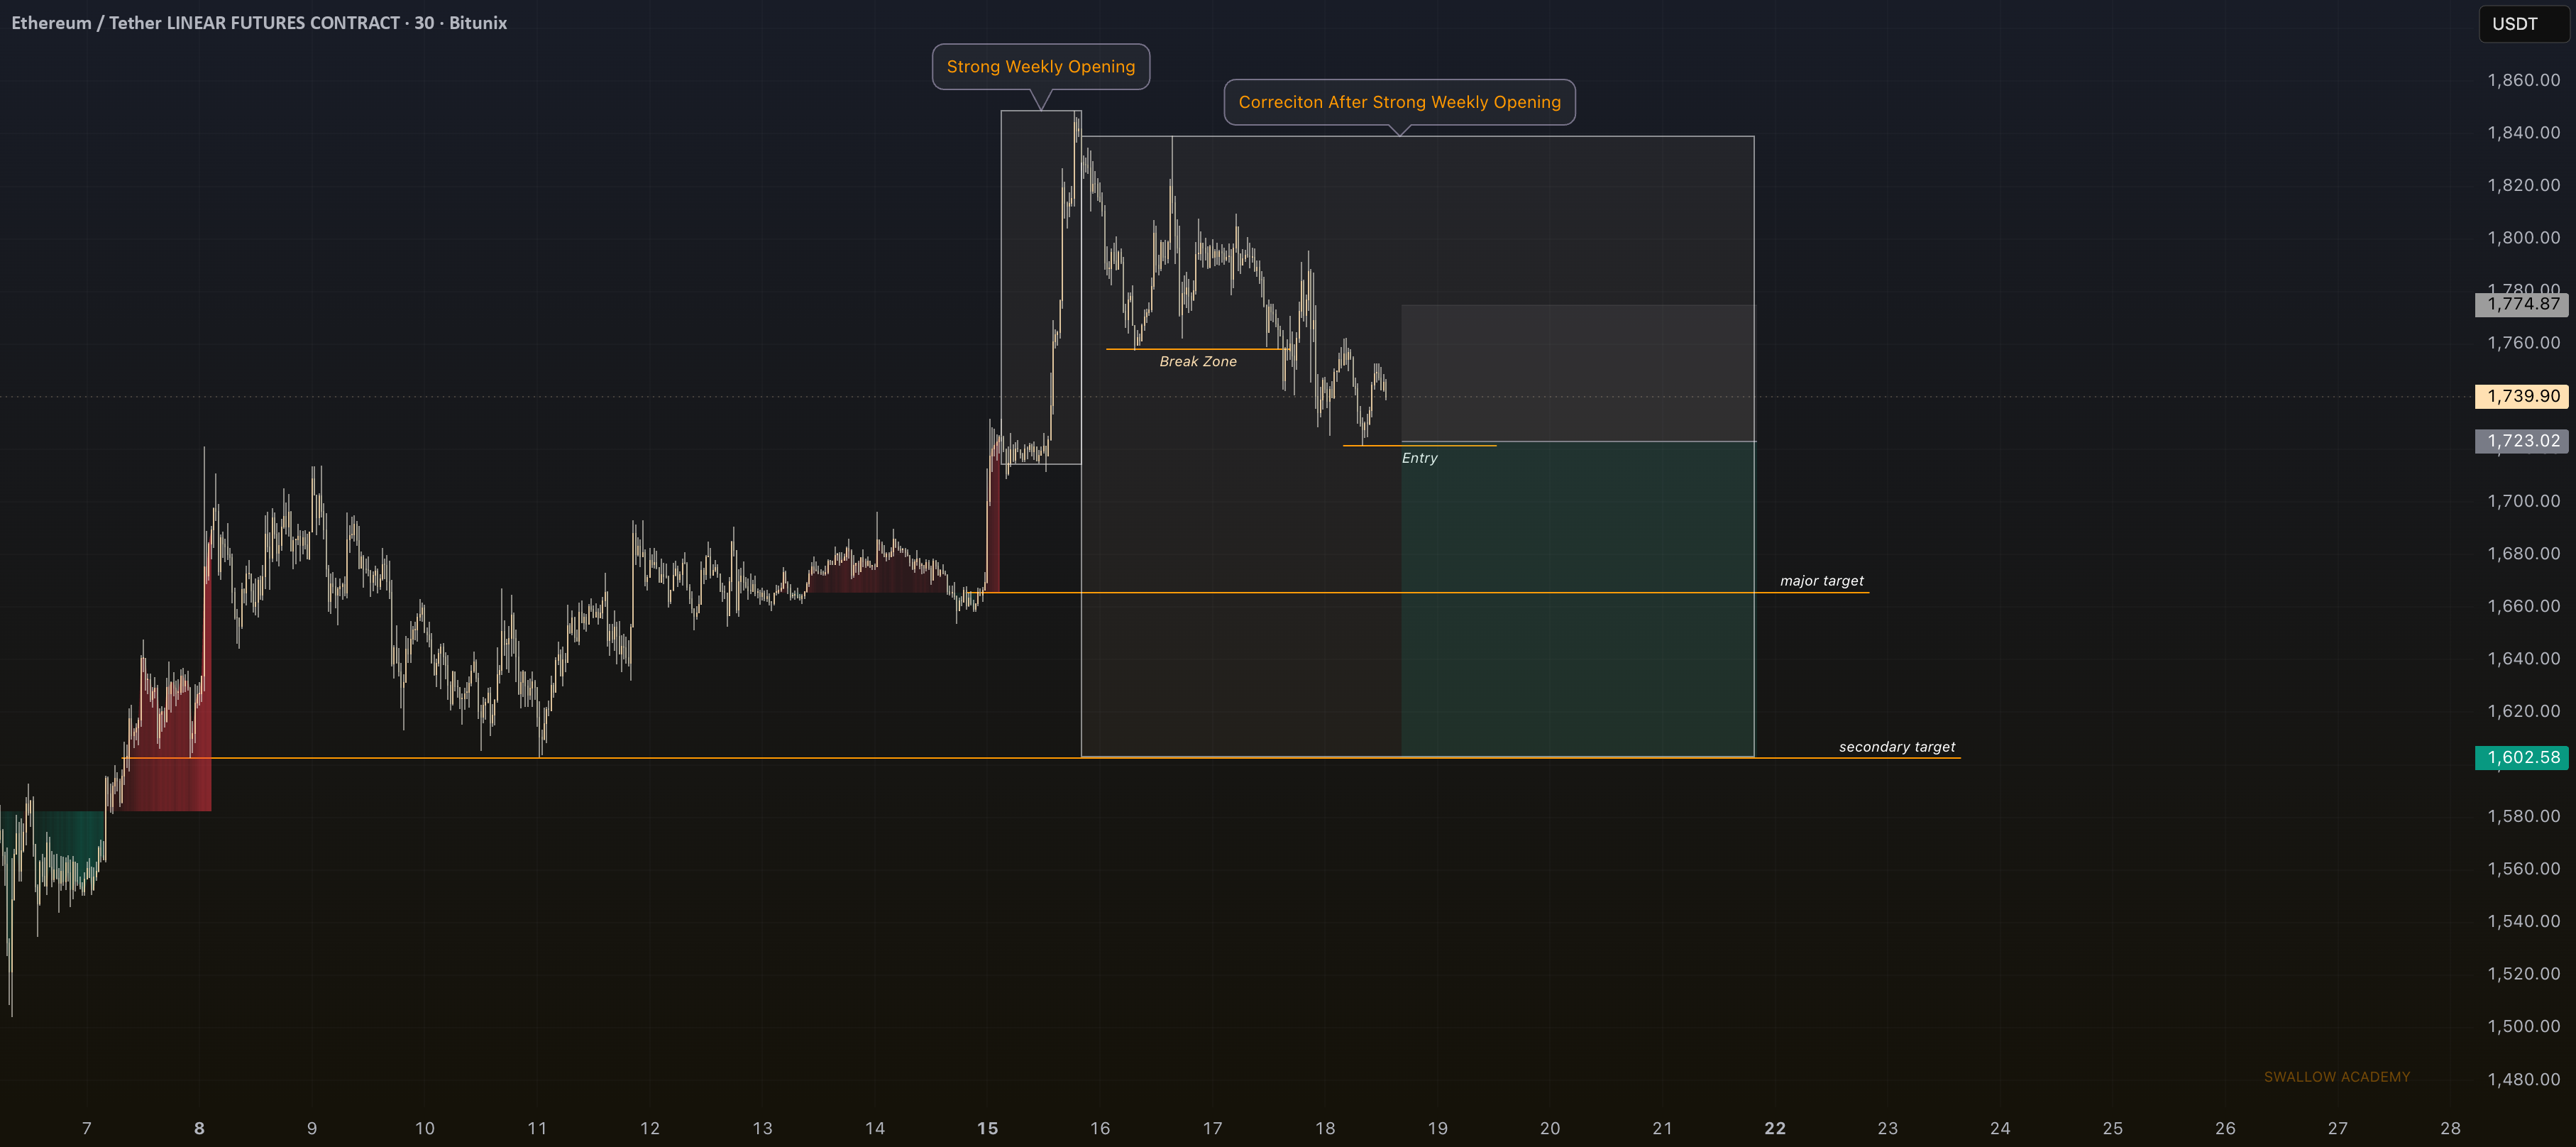
ETHUSDT Chart Shows Correction Risk
The dollar chart is not offering a simple bullish answer either. SwallowAcademy’s June 20 TradingView idea described ETHUSDT as entering a bearish correction after a strong weekly open. The analyst said the initial push was unusually aggressive, which increased the need for a deeper pullback to rebalance the move.
The setup highlighted a broken market structure and price rolling over below the $1,774 high. The stated game plan focused on selling a retest into a $1,723 entry zone, with $1,660 referenced in the idea title as part of the corrective framework.
A Relative-Value Setup With Real Risk
The combination creates an interesting but risky setup. ETH may look historically cheap against Bitcoin, but the ETHUSDT chart still shows corrective pressure. That means a relative-value trader may see opportunity while a momentum trader sees weakness.
The distinction matters. Cheap can stay cheap if market structure keeps deteriorating. For ETH bulls, the first job is not to argue valuation; it is to reclaim technical strength and start outperforming BTC again.