

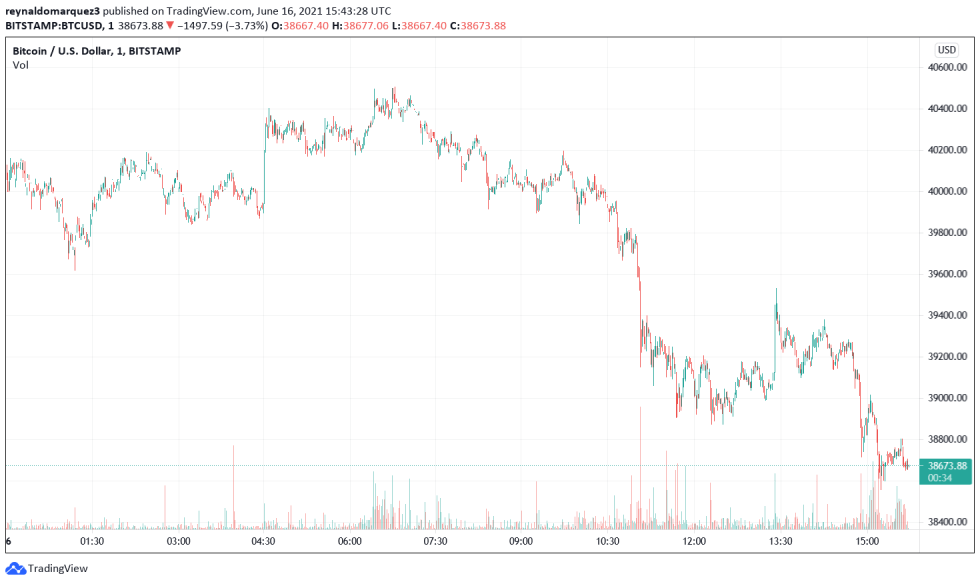
Rejected at the $41,000 resistance, Bitcoin it’s back at the higher levels of the $30,000 area. At the time of writing, the first cryptocurrency by market cap trades at $38,689 with minor losses in the daily chart.

All eyes are set at today’s Federal Open Market Committee (FOMC) meeting. During this event, the Chairman of the Federal Reserve (FED), Jay Powell, is expected to comment on their current policies.
Although it seems likely that they will maintain their current course to support the traditional market, any changes could impact stock prices. Due to the high correlation between Bitcoin and the S&P 500, a negative reaction could be felt across the crypto market.
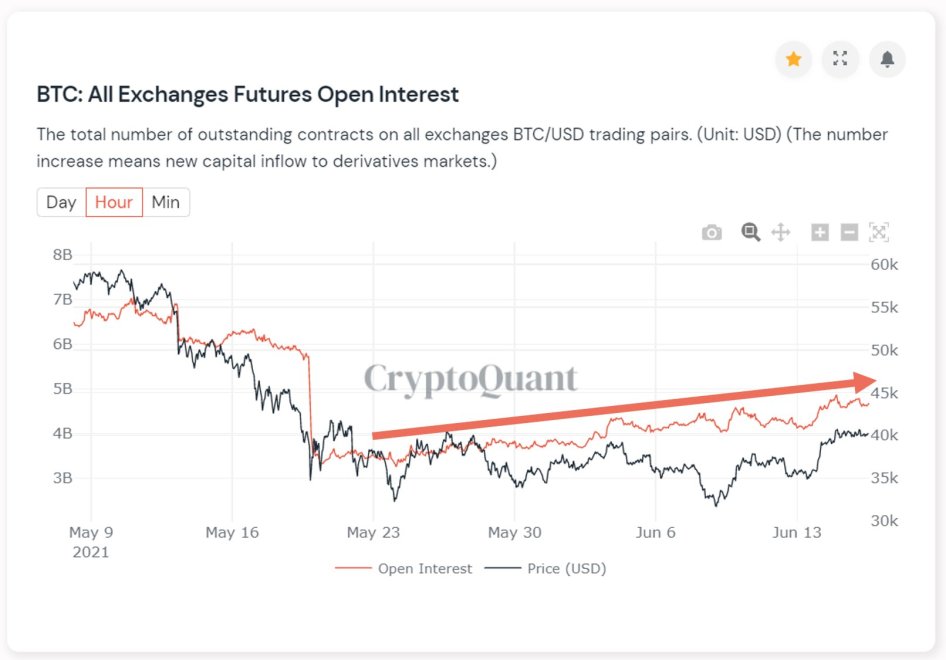
Data from CryptoQuant suggest the current price action has inspired trust in BTC investors. After May’s correction in all major cryptocurrencies, the market deleveraged and funding rates for Bitcoin-based derivatives flip negative.
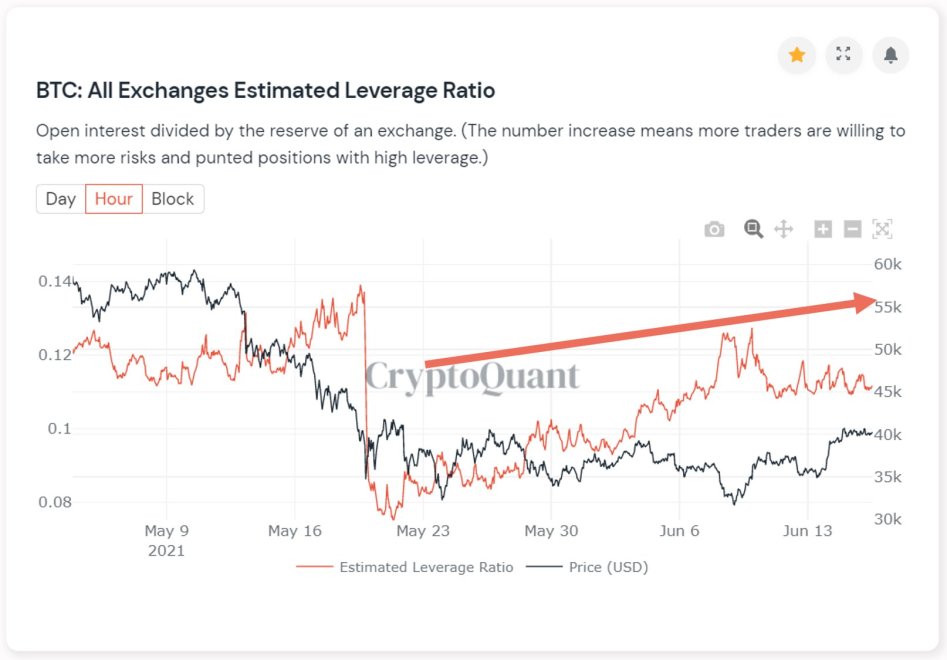
Today, CryptoQuant records neutral funding rates across all-exchange platforms, a rise in open interest, and an increase in leverage positions. Thus, it’s possible to suggest that the general market sentiment has been turning bullish.

If BTC can hold $38,000 in the short term, and if Powell’s statements cause little impact in the traditional market, the first cryptocurrency by market cap could try to make a new push towards resistance at $42,000 and $45,000.

Bitcoin Indicators Support A Rally
Analyst William Clemente shared data that indicates a potential new direction for Bitcoin’s price action. Since November 2020, BTC’s Hodler Net Position Change turned negative. This indicator shows that investors cash out from that period until June 2021.
HODLer Net Position Change has flipped green for the first time since October. pic.twitter.com/0hhjXrSdmF
— Will (@WClementeIII) June 15, 2021
Now, holders have begun re-accumulating BTC. However, as the chart shows, BTC’s price doesn’t immediately react to a change in this metric. On the contrary, in 2020 Bitcoin spend a long period consolidating around $10,000. Eventually, it broke out and reached new all-time highs.
Jurrien Timmer, Director of Global Macro, for investment firm Fidelity believes BTC’s price hit a bottom after May 21st. As the chart below indicates, the cryptocurrency formed a head and shoulders pattern and attempted to formed a double bottom.
In my view, it looks like the bottom is in. pic.twitter.com/16Eg8aHxNo
— Jurrien Timmer (@TimmerFidelity) June 14, 2021
When compared with the GS Retail Favorite Stock Picks Index (GS Retail Faves), Timmer believes the charts have similar bottoms. Therefore, BTC could pull a move to the upside, such as the GS Retail Faves.
Finally, anonymous trader “NebraskanGooner” believes BTC’s price could follow a well-known pattern of breakdown, retest, rejection, and further breakdown, in the short term. With that in mind, the trader added:
Pretty straight forward price action and moving as expected. 4H likely to confirm further downside to come (Can still chop along the way). $38.5k and $37.5-37.8k are key supports.