

- Bitcoin has seen some mixed price action as of late, with bulls being unable to take control of its trend in the time following its rally up to $28,500
- The rejection here was quite intense, and it has yet to show any signs of strength in the time following this occurrence
- The fact that bulls have guarded against any deeper drawback is positive because it invalidates the possibility that this recent high is a blow-off top
- One trader is now noting that there is an incredibly bullish indicator that is flashing for Bitcoin
- He points to the cryptocurrency’s monthly RSI, noting that a monthly close above a specific level that it is nearing is historically followed by parabolic moves higher
- In the past, these movements have had an average return of 1,010%, but their size and length seem to diminish with time
Bitcoin and the entire crypto market have declined over the past 12 hours, which appears to be the direct result of the pressure that XRP is placing on the market due to its latest selloff.
Where the market trends in the mid-term likely won’t depend on XRP, which means that this latest round of selling pressure may mark a knee-jerk reaction from investors.
One analyst is noting that Bitcoin’s monthly RSI is flashing an incredibly bullish sign for where BTC trends next.
Bitcoin Struggles to Gain Momentum Following $28,500 Rejection
At the time of writing, Bitcoin is trading down just over 1% at its current price of $26,700.
The crypto has been trading between the upper-$26,000 region and the lower-$27,000 region throughout the past few days.
It has yet to garner enough buy-side support to break above the heavy resistance laced throughout the lower-$28,000 region. For now, this peak could mark a blow-off top.
Indicator Suggests BTC is About to Go Parabolic
One trader explained in a recent tweet that Bitcoin could be on the cusp of seeing a parabolic move higher in the days and weeks ahead.
He points to the cryptocurrency’s monthly RSI as an indicator for this possibility.
“BTC – Monthly RSI. Monthly candle is about to close above 80. When this happens, bullish trend continues, with an avg. return of 1010.87%. Each cycle is shorter.”
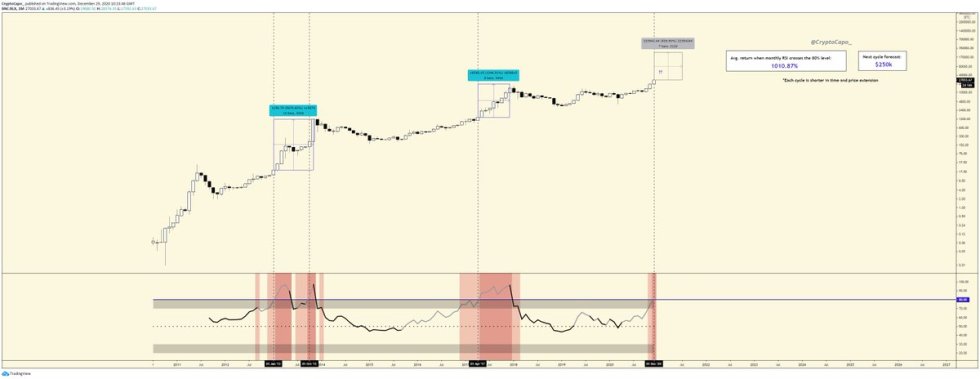

Image Courtesy of il Capo of Crypto. Source: BTCUSD on TradingView.
The coming few days should shed light on Bitcoin’s trend, as continued weakness could confirm $28,500 as a local high and lead to a deeper retrace.
Featured image from Unsplash.
Charts from TradingView.