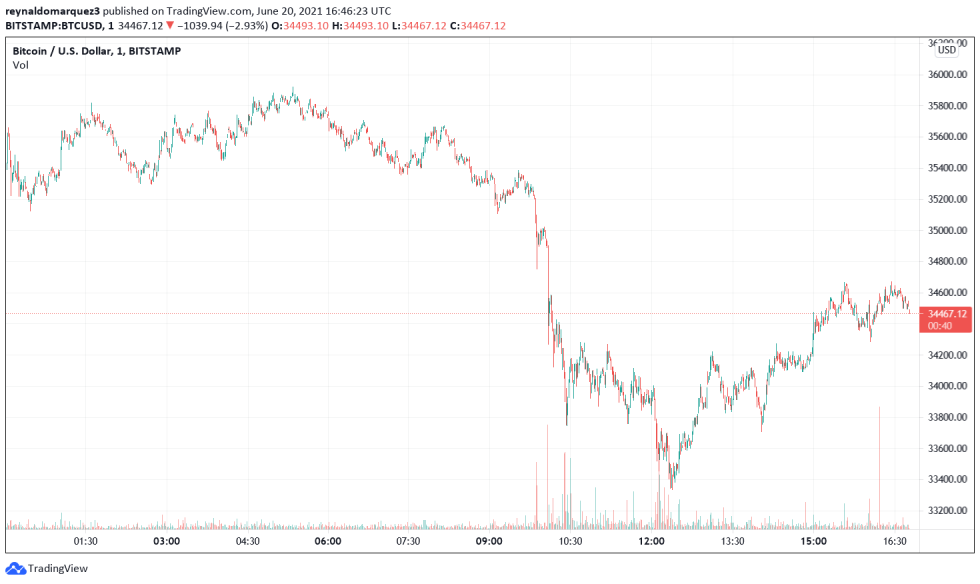
Bitcoin has displayed high volatility during the weekend. The first cryptocurrency by market cap has lost two critical support points and, at the time of writing, trades at $34,312 with a 5.3% loss in the daily chart.

Legendary former hedge fund manager Michael Burry has returned to social media. Via his Twitter account, he has made some predictions about the markets. Many are pessimistic and could be bad news for investors with long positions.
Burry is famous for predicting the collapse of the mortgage bond market. His fund Scion Asset Management made a big profit by shorting this market in the mid to late 2000s.
In his latest tweet, Burry compared Bitcoin with NFL player Troy Polamalu. Jokingly, Burry asked his followers what the cryptocurrency has in common with Polamalu and shared the chart below.

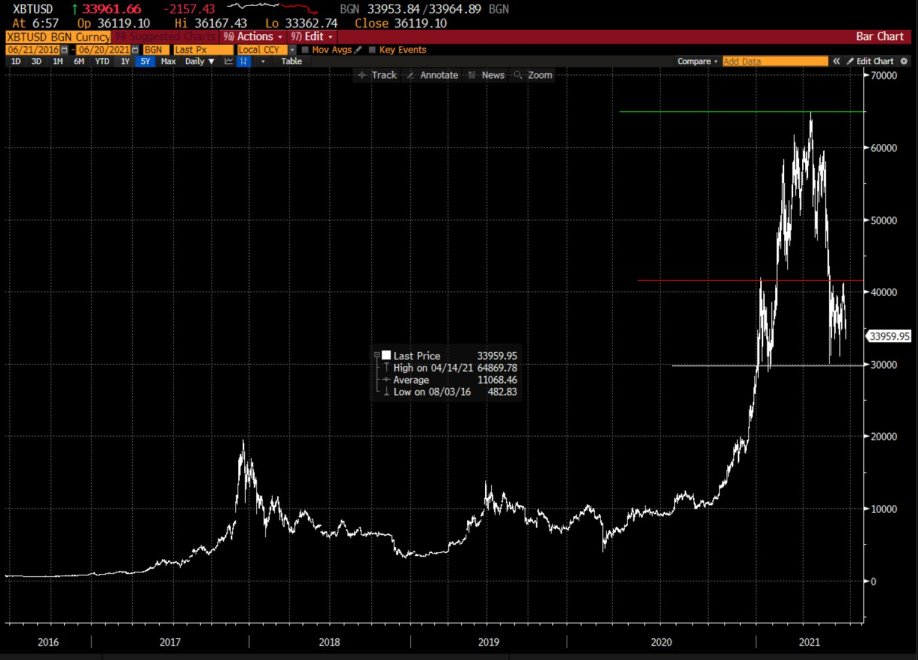
Here, the former hedge manager predicts BTC’s price will follow a Head and Shoulders pattern. This chart formation usually presents itself as a baseline with three peaks. This pattern suggests a flip from a bullish to a bearish trend.
Many replied to Burry for this prediction, some consider it accurate, and others tried to rebut it. A trader said: “It seems we’re going down to -5000$ on the negative scale. Reasonable”.
Burry has been highly critical of the crypto market’s alleged high number of investors with leverage positions. He is now betting against Bitcoin and other cryptocurrencies, as well as against profitable companies in the traditional market.
When crypto falls from trillions, or meme stocks fall from tens of billions, #MainStreet losses will approach the size of countries(…). If you don’t know how much leverage is in crypto, you don’t know anything about crypto
Bitcoin Outlook In The Short Time, Rebound Incoming?
The bulls stand at the last line of support, Bitcoin must hold above $33,500 or it risks a further retracement towards the $20,000 area. Analyst Ali Martinez has recorded several sales signals for BTC in the past 24 hours.
The first one was recorded by the TD Sequential, an indicator used to measure when a price might have exhausted an up or downtrend, in the 24-hour chart yesterday. At that time, the price dropped below $37,000 and range in the $35,000 area for several hours until Bitcoin went lower to its current levels. Martinez added:
Based on the TD, there is a chance BTC could hold above this $33.5K since this indicator is flashing a buy signal on the BTC 12hr chart.

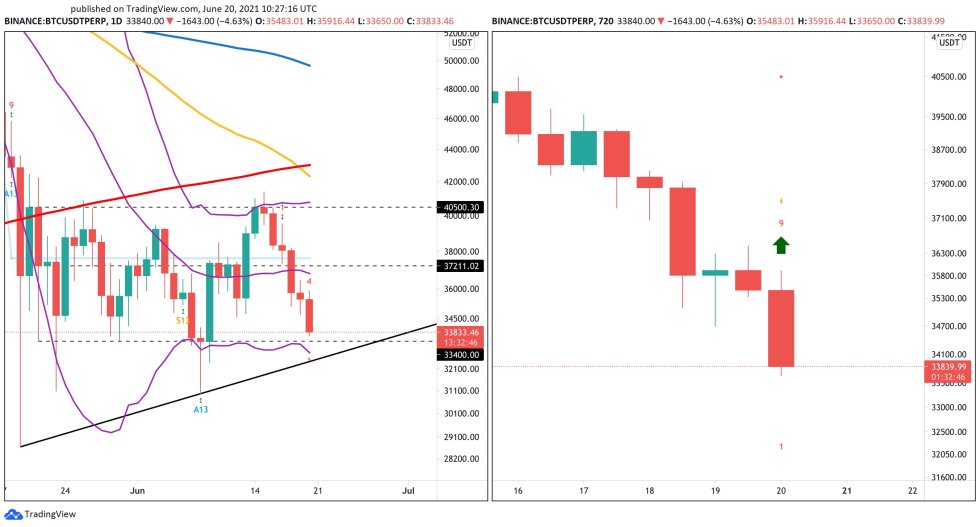
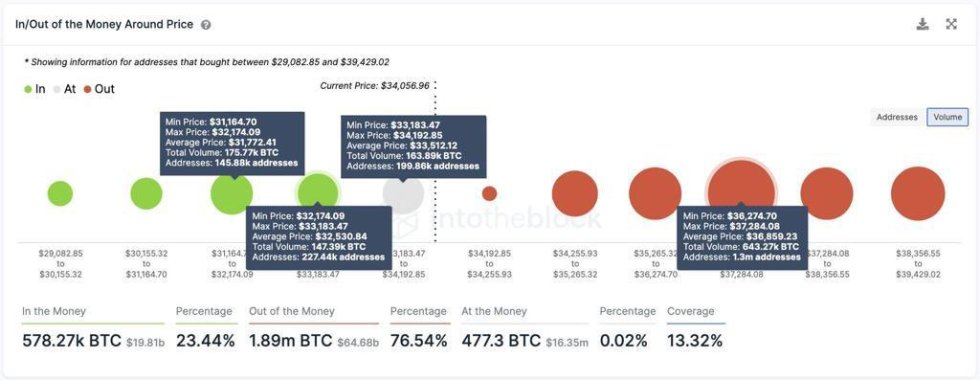
The area around $31,700 to $33,500, according to Martinez, is a major resistance zone with 1.3 million addresses that bought 643,000 BTC at those levels. The TD Sequential indicator flashed a buy signal in the 12-hour chart, Martinez said. If support holds, BTC could rebound to the $37,000 area.
(…) the most significant support zone underneath #Bitcoin sits between $31.7K and $33.5K (…). Losing this area as support could push BTC to the next critical demand barrier at $23.4K.