

Bitcoin is stuck below $20,000.
The flagship cryptocurrency has attempted to break above the psychological resistance level multiple times in the last two weeks. In one of the instances, it reached as far as $19,915 only to face a bearish assault at the new record high that pushed its price lower by $2,000. It is evident that traders’ profit-taking behavior goes wild when Bitcoin closes towards $20,000.
Bitcoin Wedge
But looking from a wider perspective, the entire range between $19,500 and $20,000 prompts traders to exit their bullish positions for a short-term profit. In late November, the BTC/USD exchange rate made two back-to-back attempts to break above $19,500, but it succumbed to higher selling sentiment near the level, falling to as low as $16,200 later.
A pullback ensued, and the price again faced the same bearish bias near 19,700 — a development from $19,500, nonetheless. And now, the $19,900-area is giving the same vibes, having been crashed the price to $18,109 upon its latest test.
The price behavior has left Bitcoin in a sequence of modestly increasing higher highs and lower highs. Envisioning them together makes it look like that they are forming a Rising Wedge.
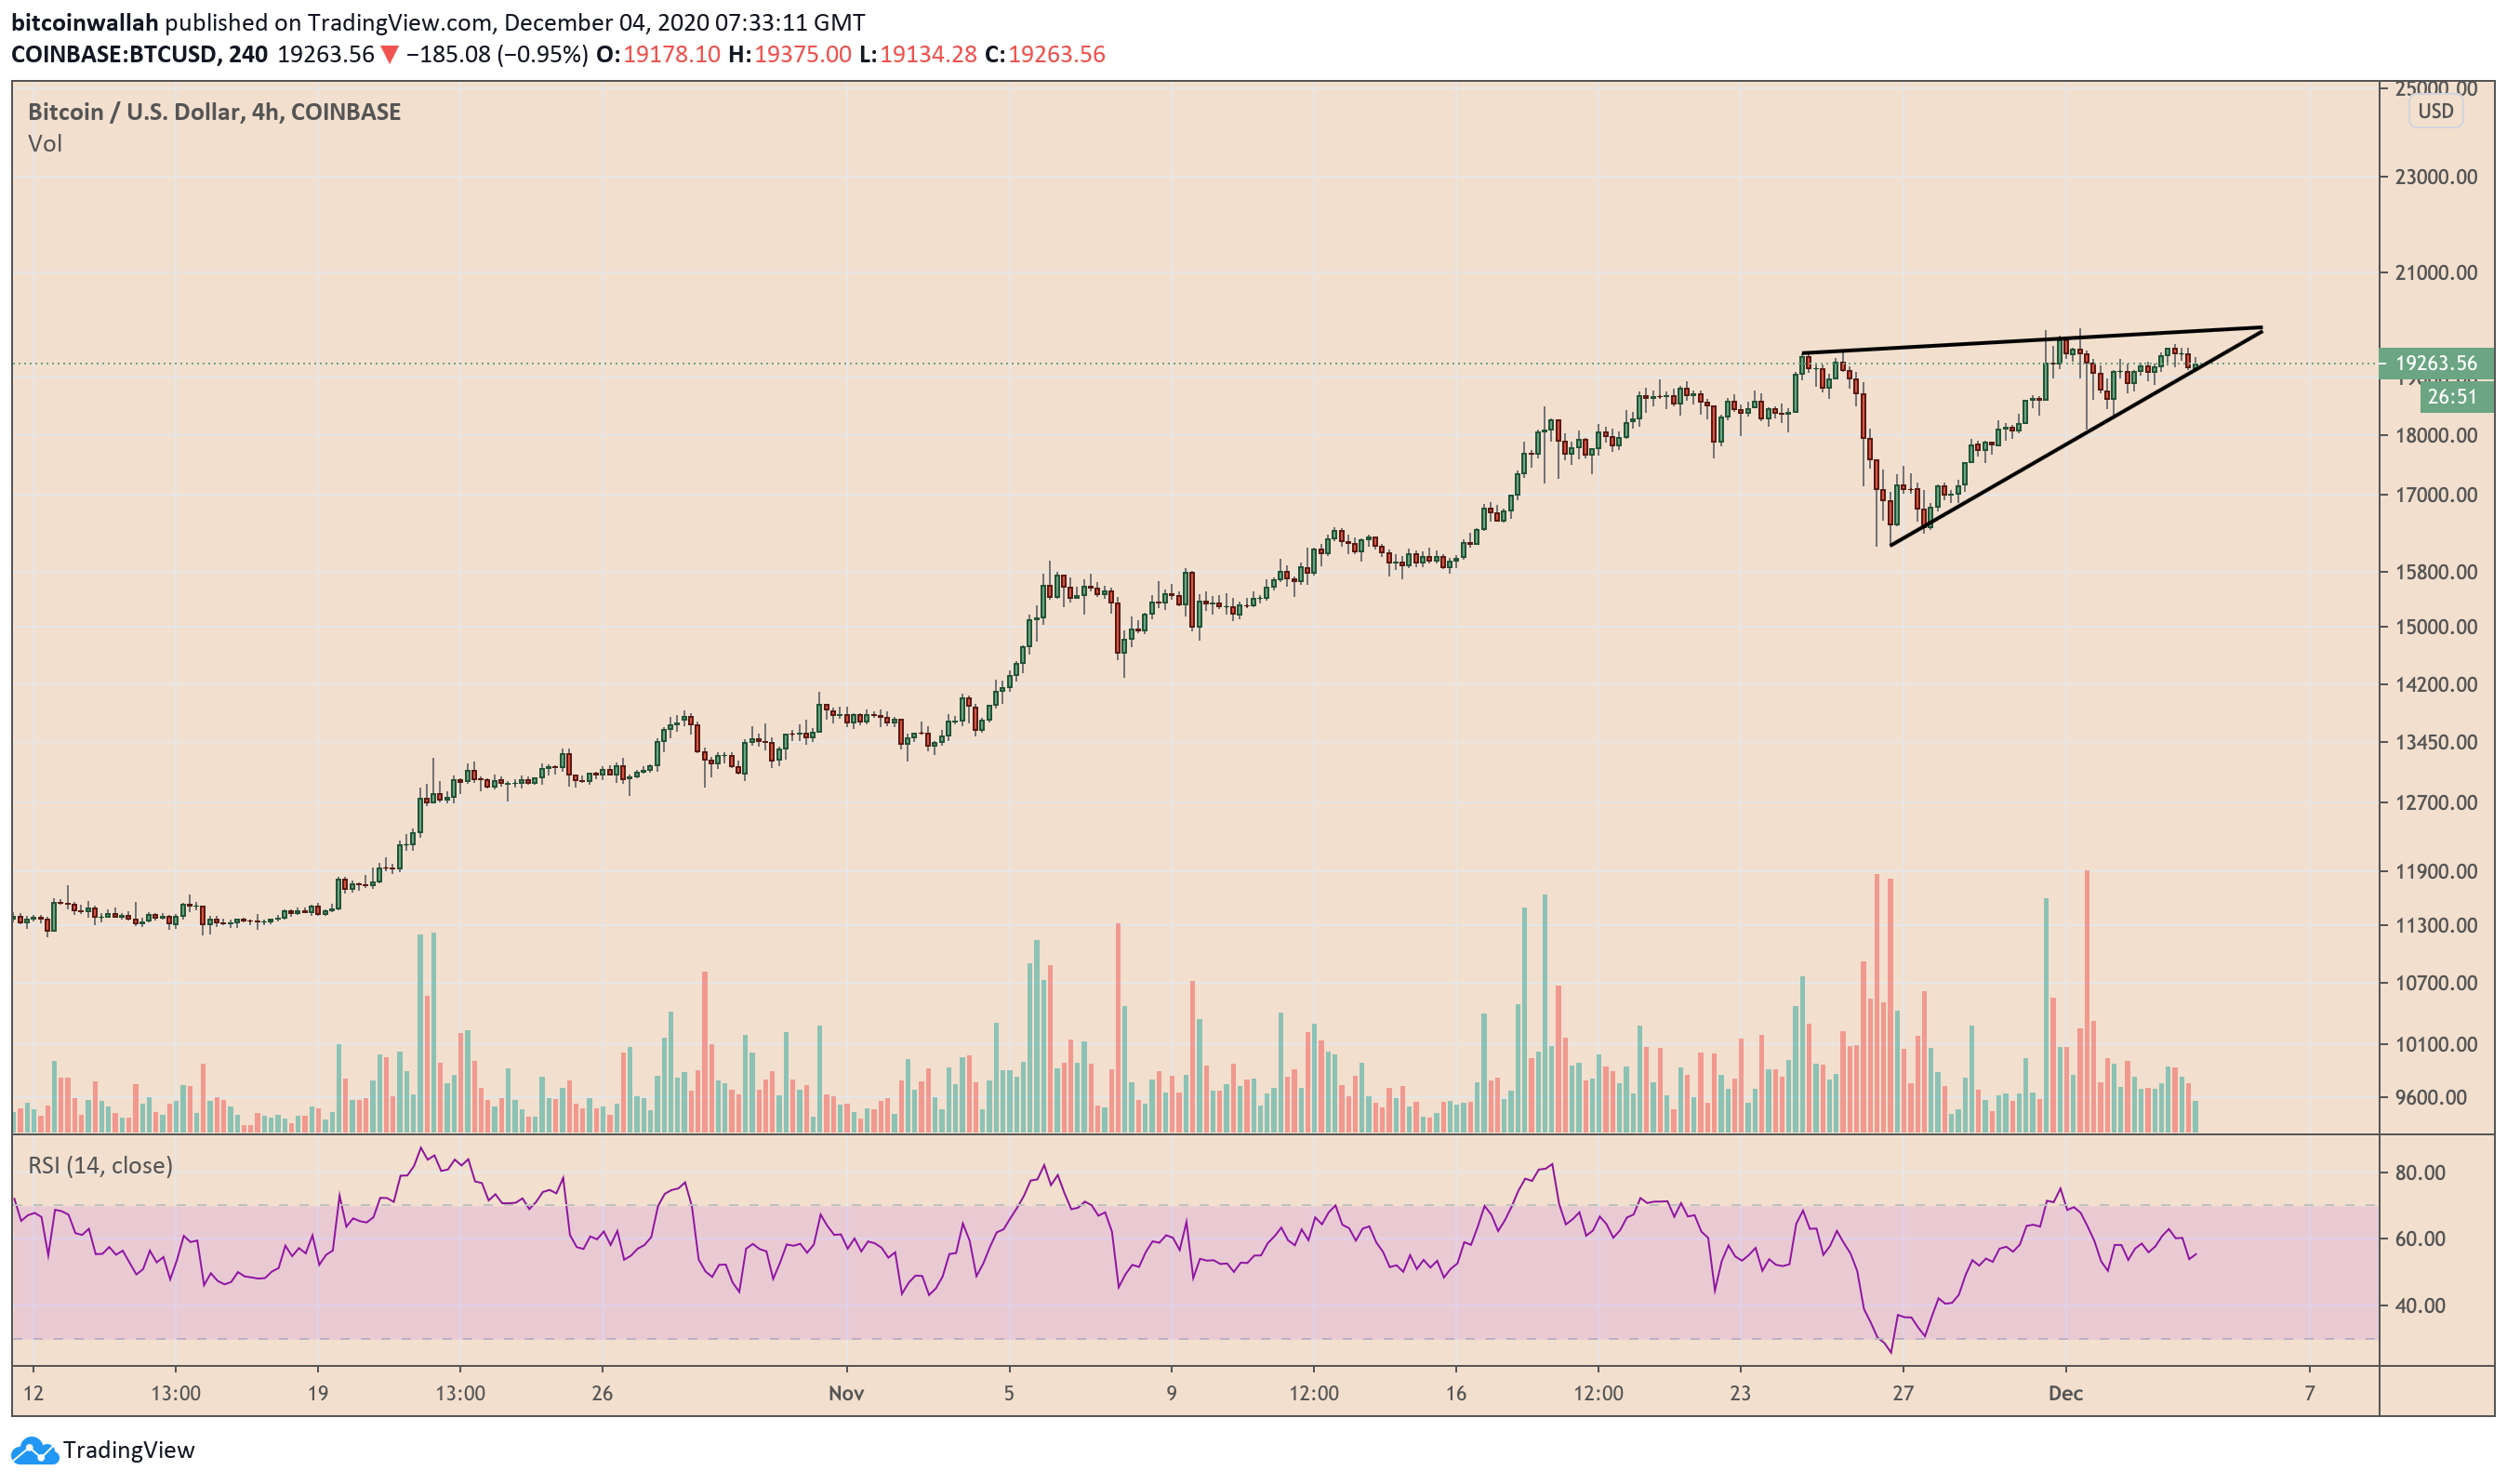
In retrospect, traders see Rising Wedge as a bullish-to-bearish reversal pattern. So it typically happens the price ascends inside the Wedge range but breaks below its support trendline eventually. If accompanied by higher volumes, the negative breakout crashed the price by as much as the maximum distance between the Wedge’s upper and lower trendline.
Bitcoin’s current Rising Wedge pattern’s height is $3,249. Depending on where it breaks lower from, its price would likely fall by roughly $3,000. That would mean a plunge towards $17,000 — at least.
But There Is A Catch
The Wedge’s upper trendline is almost flat, with the difference between higher high levels close to $200. Some traders can also assume that it is a horizontal resistance level. If true, it would throw the entire bearish reversal theory, as discussed above, into a bin.
A horizontal line makes the entire Bitcoin structure looks like an Ascending Triangle. It is a continuation pattern wherein the asset in concern typically continues in its previous trend’s direction with a breakout above the upper trendline. An ideal bull target is as much as the height of the Triangle.
That means Bitcoin price — again — expects a move worth $3,000-3,249 but to the upside. It puts the cryptocurrency’s bull target at around $23,000.
So far, fundamentals favor Bitcoin.
The inflation narrative sticks because of the Federal Reserve’s likelihood of buying short-dated bonds and corporate debts amid a low-interest environment. On the one hand, excessive US dollar liquidity prompts investors to dump the greenback. On the other, the prospects of earning lower yields divert their attention to riskier assets like Bitcoin.
That explains why the cryptocurrency’s Rising Wedge pattern appears less threatening.