

A look at the history of the Miner’s Position Index (MPI) would suggest Bitcoin miners usually sell before the bull run cycle top.
The Bitcoin Miner’s Position Index Vs The Price For Various Cycles
As pointed out by a crypto analyst on CryptoQuant, the BTC Miner’s Position Index may suggest that miners aren’t good at catching the top.
The “Miner’s Position Index” (or MPI in short) is a Bitcoin metric that’s defined as the ratio of total miner outflows divided by the 365-day moving average of the same. The inspiration behind the metric is the Puell multiple.
MPI = Total Miner Outflows ÷ Total Miner Outflows (365-day MA)
The Bitcoin MPI shows the relative miner liquidation behavior compared to the historical average. The indicator, however, makes one important assumption.
The assumption is that most of these outflows from miners are actually moving to exchanges for selling purposes.
Some investors like to use the metric to get an idea about the selling points in the Bitcoin market. But how accurate are these miners at catching the top? The below chart will show the MPI vs price trend over the past few bull runs:


The BTC MPI vs price during the bull runs since 2013
The above graph reveals two features about the indicator. The first is that during the 2013, 2017, and 2021 bull runs, miners sold their coins before the final top.
The other is that the yellow boxes in the chart seem to be good periods to buy more Bitcoin. Historically, the price has shot up when the indicator showed such values.
Related Reading | By The Numbers: Here’s How Much The Pirate Bay’s Bitcoin Donations Are Worth
Now, here is another chart, this time for the BTC Miners Reserve. This metric shows the number of coins miners are holding in their wallets.


The BTC Miners Reserve shows a gradual uptrend
This graph also showcases the behavior mentioned above; the miners reserve plunged before the 2021 ATH, implying they dumped their coins before the top. It looks like the indicator’s value is going up now, meaning miners are accumulating at the moment.
Related Reading | Diamond Hands: Short-Term Bitcoin Supply Reaches Historical Lows
So in conclusion, if the above indicators are anything to go by, it looks like miners aren’t very good traders as they seem to always dump earlier than the top. Also, another thing the MPI may suggest is that now is a good time to buy Bitcoin as currently the values are in the yellow zone.
BTC Price
At the time of writing, Bitcoin’s price floats around $47.1k, up 5.8% in the last 7 days. Over the past month, the cryptocurrency’s value is up 22.6%.
The below chart shows the trend in BTC’s price over the past three months:
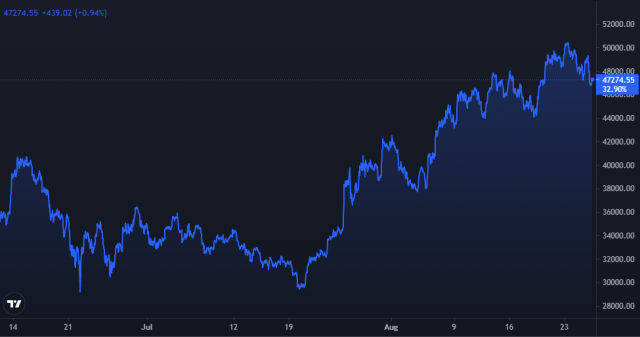

BTC's price plunges down | Source: BTCUSD on TradingView
Featured image from Unsplash.com, charts from CryptoQuant, TradingView.com