

Technical indicators suggest that the bitcoin price could be preparing for a rather significant correction, potentially sending it below $600. Traders shouldn’t have too much to fear though, as the decline is expected to be followed by bullish activity, resulting in a rise to $700 and beyond, hitting resistance at $1000.
Also read: Industry Report: The Halving That Came and Went
Bitcoin Price Looking Bearish, but Not for Long
Long-Term Analysis
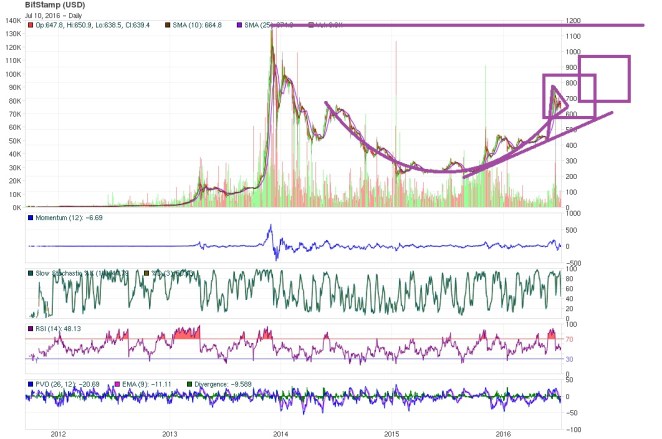

After a year where a rounded bottom pattern was perfectly accomplished, a new big pennant had taken place into the mid-term trading box, created as a result of the sideways lateral market that professional traders´ work let behind their accumulation activities. Perhaps we could see another month in the same price level while prices perform this pennant, which could become a bigger flag formation.
This kind of well-known pattern may also create a bullish consensus that provides some up-sliding of the trading box from the $600 support to the long-term Fibonacci resistance at $820, starting the first wave of the Elliot´s theoretical pattern staying inside the next level box with a probable ladder step rebound at the $700 support level. All of these movements will occur in a major zig-zag advancing pattern toward the second box´s higher resistance of $1000.
Mid-Term Analysis
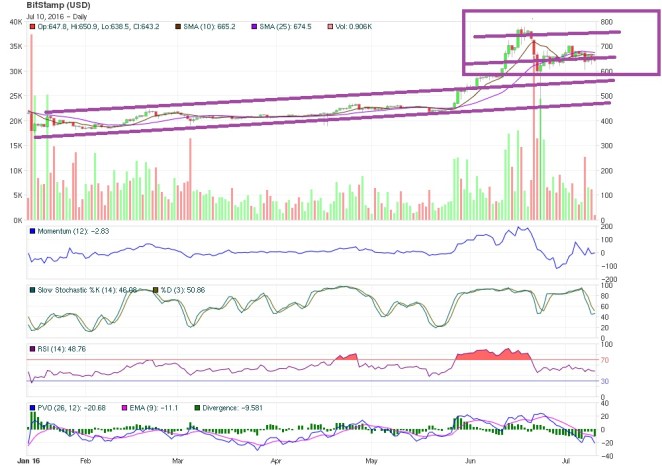

Forming a kind of trading box with support at $600 and resistance at $820, prices had composited other patterns that could help traders to figure their marketplace, like several rising lines that provide reference for making decisions.
Meanwhile, prices advance in a slow rising zig zag movement, which should become a fireworks show of growth in about 2 months’ time, when the third phase of Elliott wave theory gets real in the charts.
Right now, mathematical oscillators are giving enough signals to sustain the bullish consensus, and to allow the suspicion of far higher prices at the end of the year.
When the present flag pole reaches the $820 resistance, the support will have to be relocated at $700 like a ladder step rise sliding the box to next level.
Short-Term Analysis
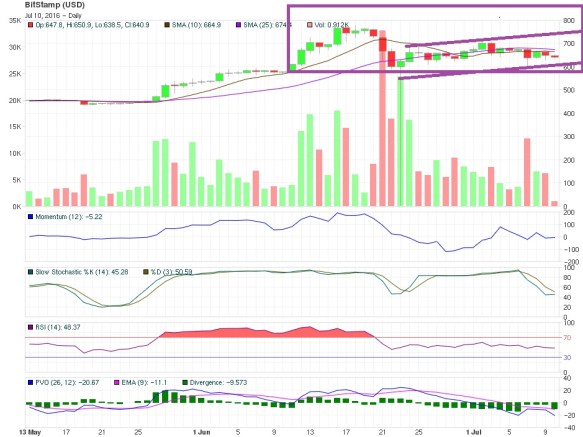

According to volume indicators and candlestick analysis, prices are preparing for a down movement, which may create panic selling from weak hands. This selloff would hit a big support level below $600—probably near 580—where strong hands and big players could be planning their purchases.
After this probable downward slide, the next movement in the present trading box could send prices upward for another 100 points, performing a fast rebound to $820.
Following that rise, a bear correction will send the bitcoin price to a new support level around $700, launching a new sideways lateral movement with resistance at $1000. This trading pattern is expected to hold for the next two weeks.
What do you think will happen to the bitcoin price? Let us know in the comments below!
Featured image courtesy of Shutterstock.