

For all intents and purposes, Bitcoin is back in a bull market. But even bull markets don’t always simply move upward in a straight line. Along the way, the road gets rocky, and violent and volatile corrections wipe out weeks of progress made in a matter of one or two.
Data shows that past bull market corrections average roughly 37% in downside, according to iconic career commodities trader Peter Brandt. If a similar correction follows the recent rally, here is the potential target for the bottom of what is likely to be a short-lived spike down, along with a look at why the cryptocurrency corrects to such a specific price point in bull markets.
Pro Trader Peter Brandt Points To Possible 37% Correction In Bitcoin Based On Past Bull Markets
Bitcoin price is up 20% in November 2020 alone. From the early September bottom to the recent high, in less than three months the leading cryptocurrency by market cap added more than 65% to its total value per BTC.
Since the Black Thursday bottom, Bitcoin has risen over 330%. The last seven weekly candles have been green and price action has gone parabolic. At this point, it is becoming difficult to deny that the top crypto asset is beginning another bull run.
RELATED READING | BLOOMBERG SENIOR STRATEGIST: BITCOIN MAY TURN “PARABOLIC” IN 2021
But even Bitcoin corrects during bull markets, and when it does, the results can be violent. According to Peter Brandt, who famously predicted the over 80% decline from top to bottom based on nothing but data from past parabolic breakdowns, Bitcoin bull market corrections decline roughly 37% on average.
During the 2015-2017 bull market in Bitcoin $BTC, there were 9 significant corrections with the following averages:
37% decline from high to low
14 weeks from one ATH to the next ATHSince the early Sep low there have been two 10% corrections pic.twitter.com/E1LbN7VDa5
— Peter Brandt (@PeterLBrandt) November 16, 2020
Brandt warns that there were nine “significant corrections” during the last bull market, while this time around, the cryptocurrency has only had two 10% pullbacks. Each correction is roughly 14 weeks from a new peak to peak. Currently, the cryptocurrency is on week twelve in a row without anything meaningful for a correction.
Reading between the lines, Brandt is warning that a correction is coming and that buyers need to beware.
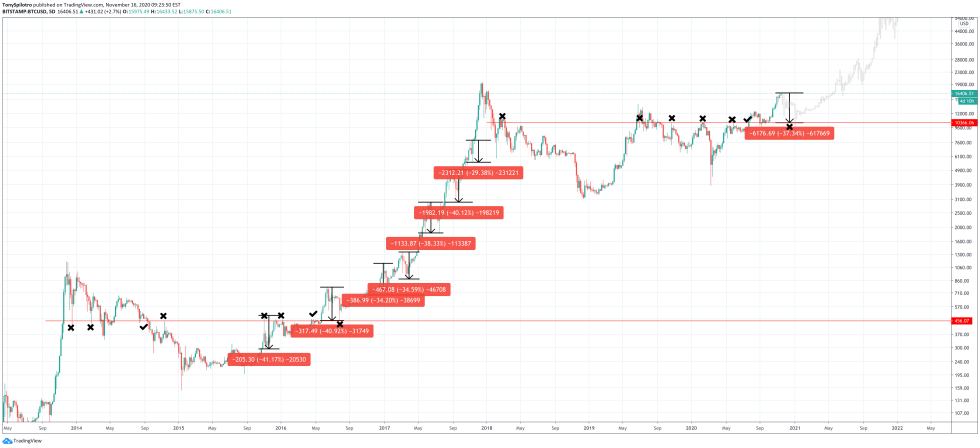

Bull market corrections average to about 37% according to data | Source: BTCUSD on TradingView.com
Why The Cryptocurrency Appears To Crash To The Same Key Level During Bull Runs
Brandt’s data and the Bitcoin price chart itself, show an average of roughly 37%. Most corrections according to our interpretation of the chart above, resulted in a 40% drop. Crashes typically lasted less than a month in most examples.
But why the recurring number when it comes to cryptocurrency bull market corrections? The answer can be found in mathematics, potentially.
RELATED READING | NEARLY 99% OF BITCOIN OWNERSHIP HAS BEEN PROFITABLE, DATA REVEALS
Bitcoin corrects roughly 37-40% when it does finally pull back. That range is a sweet spot for the 0.618 Fibonacci retracement level or roughly 61.8% of the initial rally.
It is not clear why this mathematical relationship with price action exists but can be used strategically to find potential levels where support may exist and buyers could show up with strength.
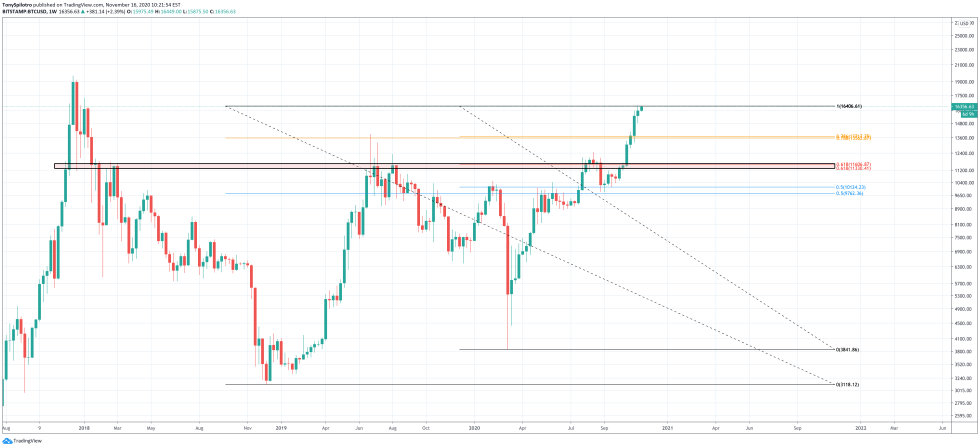
Each crash falls back to the 0.618 Fibonacci level | Source: BTCUSD on TradingView.com
The level could be intuitively an attractive value to investors at that point, prompting the sudden interest. A drop of such magnitude at current levels would take Bitcoin price back to roughly $11,500, and as you can see below that price points sandwiched between the 0.618 level from all-time high and the 2020 rally, and over three years worth of bear market resistance.
FEATURED IMAGE FROM DEPOSIT PHOTOS, CHARTS FROM TRADINGVIEW.COM