
Bitcoin has crashed down to $42k, resulting in liquidations in the entire crypto futures market worth almost $900 million in the last 24 hours.
Bitcoin Crash Leads To Crypto Liquidations Of Around $900 Million
Yesterday, the price of BTC plunged down to less than $43k, causing liquidations of a little less than $900 million in crypto futures on derivatives exchanges.
Here is a chart that shows the trend in the price of the crypto over the last five days:
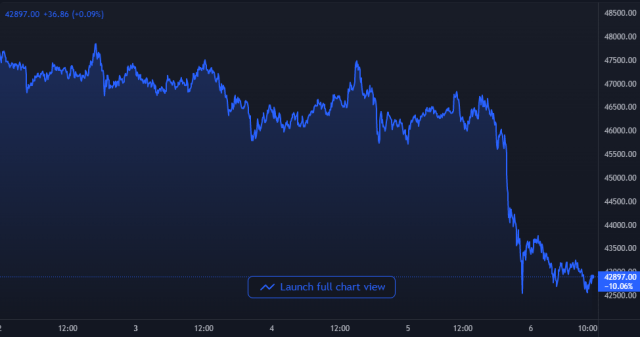

BTC's price has plunged down in the past day | Source: BTCUSD on TradingView
As a result of this crash, the coin’s price now floats around $42.8k, noting losses of about 8.5% in the last twenty-four hours alone.
Related Reading | Why Bitcoin Could Go Downstream in 2022 and Record More Losses
The below table shows how the futures market has reacted to this crash.
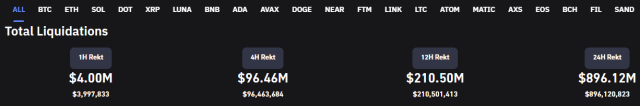

Liquidation data of the entire crypto derivatives market | Source: Coinglass
As you can see from the data, almost $900 million in contracts were liquidated in the last 24 hours. $210 million of which were in the past twelve hours.
Related Reading | Bitcoin Plummeted by 10% in 8 Hours! How do We Survive the Cold Winter?
Almost $800 million of these liquidations were from long contracts, with exchanges Okex and Binance accounting for the biggest part of the contracts.
In case anyone isn’t aware of how the derivatives market function, a “liquidation” occurs when a futures contract goes into so much loss that the exchange is forced to close that position.
Since the futures market allows for the use of leverage, any loss that a user incurs is multiplied by the same amount as the leverage. Due to the high volatility of cryptocurrencies, big liquidations are commonplace in the market.
Despite The Dump, Leverage Ratio Still Remains High
As pointed out by a CryptoQuant post, the Bitcoin leverage ratio doesn’t seem to have budged much despite the crash.
To understand how the “estimated leverage ratio” indicator works, two other BTC metrics need to be looked at first.
The first indicator is the “open interest,” which is a measure of the total amount of derivatives contracts currently open in the market.
The other is the derivatives exchange reserve, which simply shows the total amount of BTC stored on these exchanges.
The Bitcoin leverage ratio measures the ratio of these two indicators. With the help of this metric, it becomes possible to tell how much leverage users on average make use of.
Here is a chart for the metric:


Looks like the value of the indicator hasn't changed much due to the crash | Source: CryptoQuant
As you can see in the above graph, the Bitcoin leverage ratio seems to not have changed much even after the crash.
This can mean two things, either the positions currently open on exchanges are mostly short positions, or the price drop wasn’t sharp enough to kill many long positions.
Featured image from Unsplash.com, charts from TradingView.com, CryptoQuant.com