

On-chain data shows the Bitcoin supply in loss is still around 48%, which is lesser than the values observed during past bear market bottoms.
About 52% Of The Total Bitcoin Supply Is In Profit At The Moment
As pointed out by an analyst in a CryptoQuant post, BTC may see further decline before a bottom is in as more than 50% of the supply is still in profit.
The “supply in profit” is an indicator that measures what part of the total Bitcoin supply is currently being held at some profit.
The metric calculates this value by looking at the transfer history of each coin on the chain to see what price it was last moved at.
If the previous transaction price of any coin was less than the current BTC price, then that particular coin is said to be in profit and is counted by the metric.
A reverse indicator is the “supply in loss,” which tells us about the underwater supply and is simply calculated by subtracting the percent supply in profit from 100.
Related Reading | Ethereum 2.0 Weekly Deposits Have Slumped Down To Lowest Ever
Now, here is a chart that shows the trend in the Bitcoin supply in profit over the last few years:


The value of the metric seems to have been declining in recent months | Source: CryptoQuant
As you can see in the above graph, the quant has marked the relevant zones of trend for the Bitcoin supply in profit in relation to bottoms.
It looks like whenever the metric’s value has approached 40% or less, bottoms have formed for the previous bear markets.
Related Reading | Demand Response: Texas Bitcoin Miners To Shut Operations To Alleviate The Grid
The current value of the indicator is 52%, which is still more than the value needed to reach this historical bottom zone.
This means that a higher amount of the supply still needs to go into loss before a bottom formation could take place, which would only happen if BTC faces further downside still.
Last month, when Bitcoin dropped down to a low of $17.6k, the supply in loss reached more than 50%, but it was still lesser than the required 60% threshold.
BTC Price
At the time of writing, Bitcoin’s price floats around $19.7k, up 2% in the last seven days. Over the past month, the crypto has parted ways with 30% in value.
The below chart shows the trend in the price of the coin over the last five days.
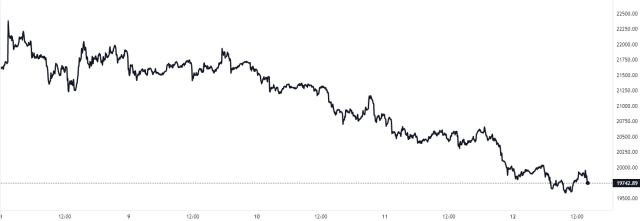

Looks like the value of the crypto has been trending downwards over the last few days | Source: BTCUSD on TradingView
Bitcoin seemed to be comfortably seated above $20k during the past week, but over the last day the coin has once again slumped below the level.
Featured image from Marc-Olivier Jodoin on Unsplash.com, charts from TradingView.com, CryptoQuant.com