
BitcoinAverage, April 12, 2016 — The price of bitcoin had little to show last week relative to the range of price movement mostly sideways trading, which hit $423 on the upper limit and $415 on the lower end.
This article was provided by the Vanbex Group on Behalf of BitcoinAverage.
The Weekly BitcoinAverage Report
![]()


The most exciting activity was a run up to $424 on April 8th, applying counterweight to the previous week’s low of $416.
Later, a sell-off to $412 after failing to break to break up wards ruffled some feathers.
The low shook out the feeble hands, turned traders bearish and tossed off weak bulls as many had been expecting a final break of $425.
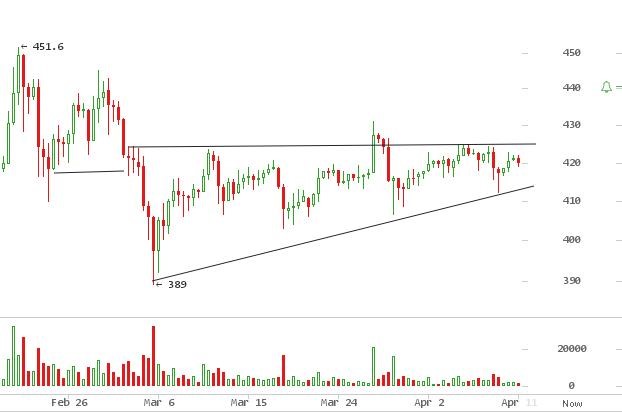
Seen above — a 12-hour chart on Bitstamp — it shows how little activity there has been since the $389 dip in first week of March.
Clearly, $424 has proved itself a hurdle with three consecutive failed attempts to break the mark. There is optimism however, as all the low dips have respected increasing lows establishing a rising trendline, which included this week’s $412 low on Apr. 9.
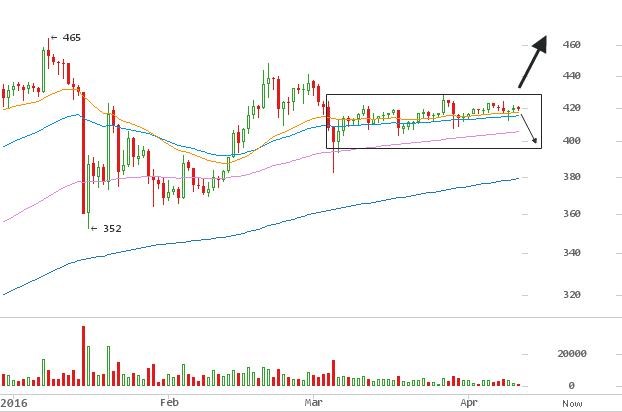
The one-day chart of exponential moving averages (EMA) shows support by both 30- and 50-day EMA lines.
The pattern highlighted in the rectangle resembles a squeeze before a pop in either direction, similar to that seen from Jan. – Feb. 15.
The price could break out to $440 if EMAs continue to support, otherwise, a failed break could fall to $400 or below.
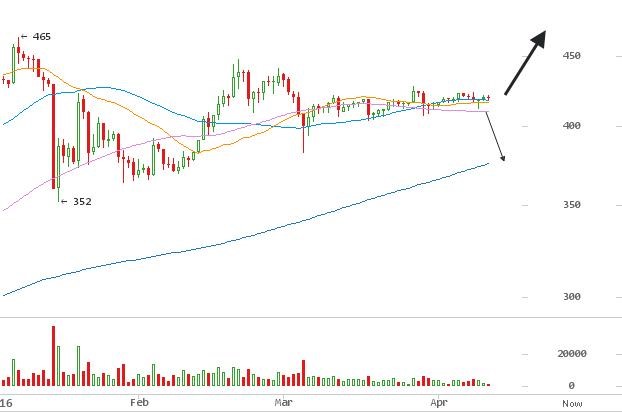
Furthermore, the direction of a breakout is not clear on one-day charts with simple moving average (MA) lines.
It seems there is no real support from 30-, 50- and 100-day MA lines. The whipsaw (up, then down movement) seen certainly adds to uncertainty.
A price fall is possible with projections slated at $375, at worst.
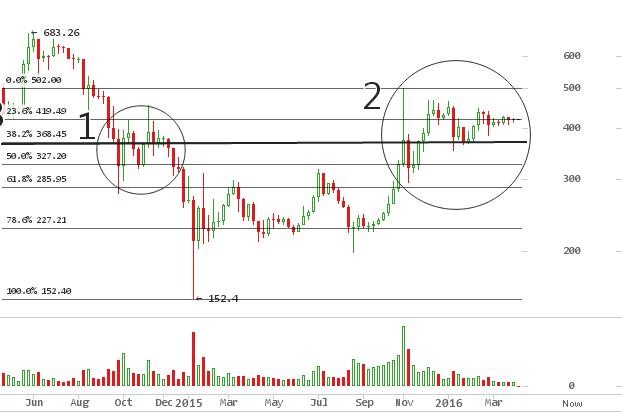
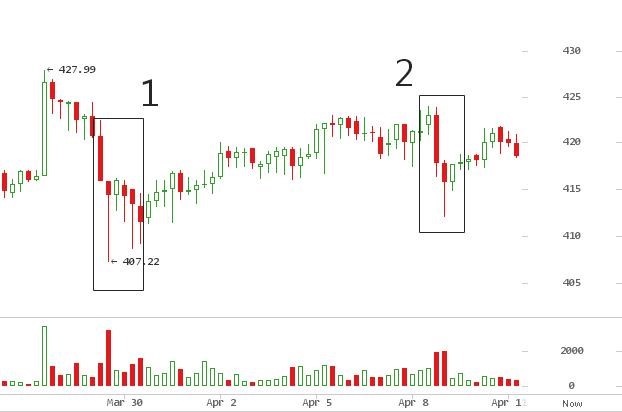
The one-week chart above best captures the state of traders’ ambivalence at this price level.
Highlighted areas (1) and (2) are similarly large corrective patterns in the middle of directional trends and coincidentally occur at the same price level. There is a lot to be said about this level, as it also matches with a 38.2% Fibonacci retracement. It extends from a $152 low on Jan. 12, last year, to the $504 high by Nov. 3.
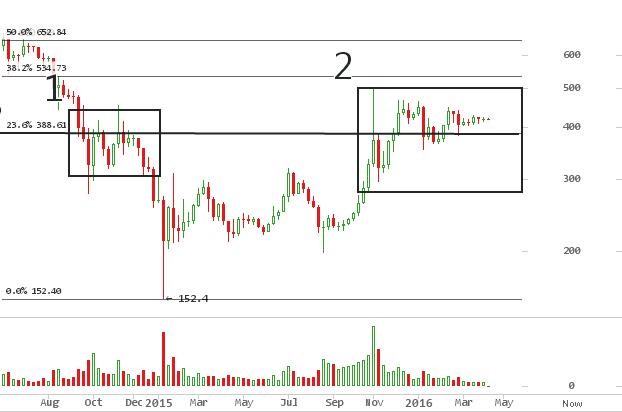
The chart above shows that Fibonacci levels extend across the whole bear market since the $1,163 all-time high in December 2013 up until the point the price fell to $152 in January 2015. It emphasizes an imminent break out, without revealing much about direction.
Elliott Wave theory puts forth one of 2 high probability alternatives. The theory assumes the market has been in a corrective state since the high of $1,163.
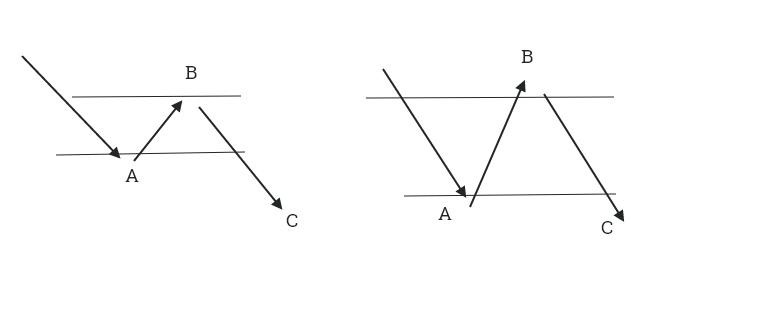

Alternatively, on the right, it could continue on its bull run from October 2015 to a high B, close enough to the all time high at $1163. Thus, B would reach upwards of $650, with an allowance for up to $1000.
Below is a better illustration on a price chart.
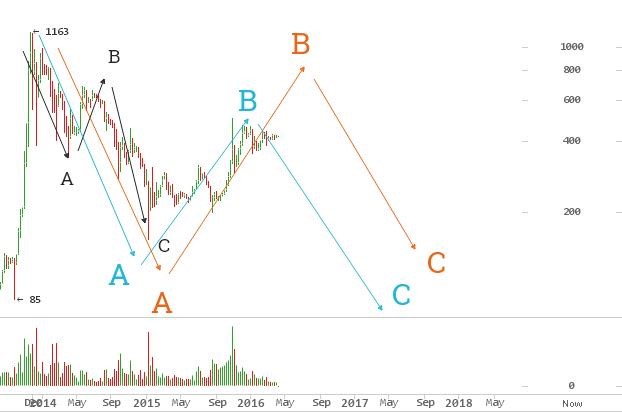
- In Black is the correction that happened from $1163 to $152
- In Blue is a similar corrective pattern but on a higher fractal. This would mean $504 is B top
- In Red is a different corrective ABC, with a B top that is not complete yet. Target is as high as $1000 and $504 will be surpassed in a continuation trend
With the upcoming price halving in July, speculation is leaning to a continuation of the trend, at the very least up to $650. The convergence of events makes it a risky trade, with a high potential payoff. The block size debates seems to have flamed out and core developers are churning out updates to Bitcoin core and testing Segregated Witness. All of a sudden, Bitcoin is looking stable both on the protocol development front and price wise.
About BitcoinAverage:
BitcoinAverage.com is the first aggregated bitcon price index that was initially launched in August 2013 with a goal to aggregate rates from all available Bitcoin exchanges around the world and provide a weighted average bitcoin price.
As of March 2014 we have over 30 exchanges integrated and are directly serving over 50,000 users monthly plus providing data to numerous other websites and resources.
What do you think will happen to the bitcoin price in the near future? Let BitcoinAverage know in the comments below!
Images courtesy of BitcoinAverage