

- Bitcoin is flashing signs of weakness following the intense selloff it saw yesterday
- Sellers ultimately forced its price as low as $11,100 before it found significant support that allowed it to rebound up towards $11,400
- This momentum proved to be fleeting, however, as BTC’s price quickly retraced back down towards $11,300 following this movement
- It now appears to be at risk of seeing significantly further near-term downside
- Some analysts are even targeting movements down towards $10,000 in the days ahead
Bitcoin is currently facing some intense selling pressure that is putting its position within the lower-$11,000 region at risk.
This came about following a period of relative stability seen yesterday after the crypto’s price was able to bounce at lows of $11,100.
It does appear that BTC may soon revisit these lows, as sellers are currently attempting to take control of the crypto as the selling pressure begins ramping up.
$11,300 has become slight support for the benchmark digital asset, as buyers have been ardently guarding against a break below this crucial price level.
Nonetheless, one top trader is now setting his sights on a plunge towards $10,000 in the coming days, which would mark a notable decline from the crypto’s recent highs of $12,400.
Bitcoin Shows Signs of Weakness as Selling Pressure Ramps Up
At the time of writing, Bitcoin is trading down marginally at its current price of $11,300. This is around the price at which it has been consolidating at following the decline to $11,100 seen yesterday.
After tapping these lows, the crypto was eventually able to surge as high as $11,400, but it faced a rejection here that subsequently led it down to its current price level.
One trader is noting that BTC is currently trading around a price region he is comfortable longing, although a break below here could be dire.
“Don’t know how [much] BTC has in the tank today. Looking to operate within the LTF levels but seeking another downside move. While the line is blue, I’ll be long,” he said while pointing to the below chart.
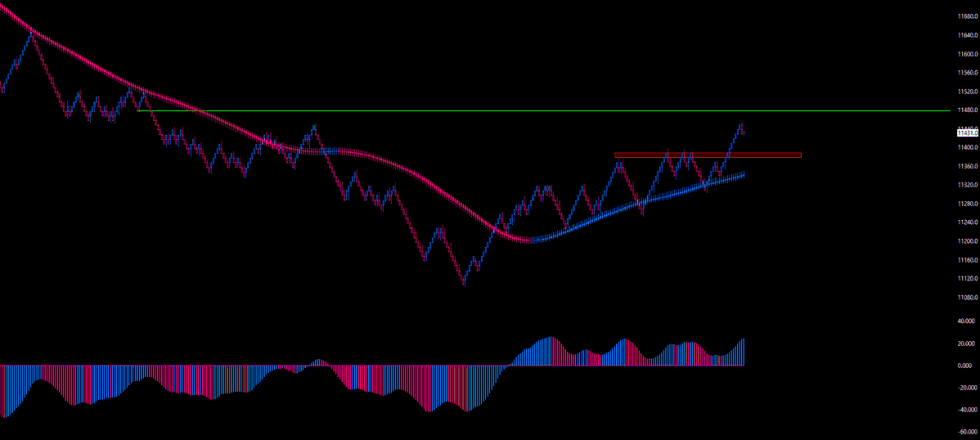

Image Courtesy of Cold Blooded Shiller. Chart via TradingView.
Here’s How Low BTC Could Reel if It Breaks Below $11,300
Although this level might provide Bitcoin with some support in the near-term, a break below it may send the cryptocurrency plunging to new local lows.
One analyst put forth a chart showing that his downside target sits around $10,300.
“BTC – Short plan if it sets up. Blue arrows / trigger points / entries. Looking for an over back under at the pivotal mid range,” he explained.
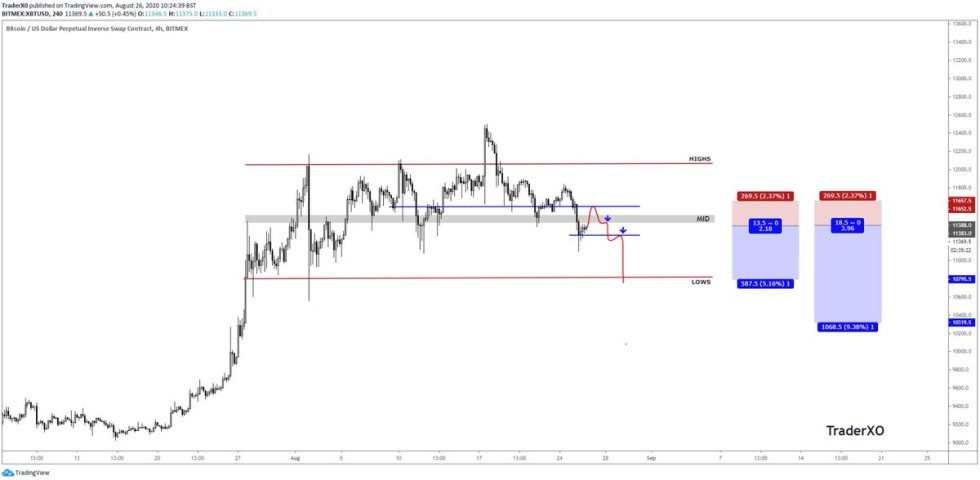

Image Courtesy of TraderXO. Chart via TradingView.
How Bitcoin reacts to $11,300 as the day drags on should be the factor that determines how it trends during the rest of the week.
Featured image from Unsplash.
Charts from TradingView.