

As the current Bitcoin halving cycle continues to advance, here’s what the previous cycles looked like at similar points in their lifespan.
The latest Bitcoin Cycle Recently Passed The 150,000 Blocks Milestone
A “halving” is a periodic event where Bitcoin’s mining rewards (that is, the block rewards that miners receive for solving blocks) are cut in half. This takes place every 210,000 blocks or approximately every four years.
As the block rewards are basically the amount of new BTC supply being created, being halved means that the asset becomes more scarce. This is why the halving is a feature of the BTC blockchain; by controlling scarcity like this, the inflation of the coin can be checked.
So far, Bitcoin has observed three halving events: first in November 2012, second in July 2016, and third in May 2020. The next such event is estimated to take place sometime in 2024. In the beginning, the reward for mining a block was 50 BTC, but today, after all these halvings, miners are receiving just 6.25 BTC per block.
Since halvings are periodic, they are a popular way of mapping BTC cycles by using them as the start and end points. An analyst on Twitter has done the same and has compared the different cycles so far against each other using the number of blocks since the cycle starts as the common denominator between them.
Here is a chart depicting this comparison:

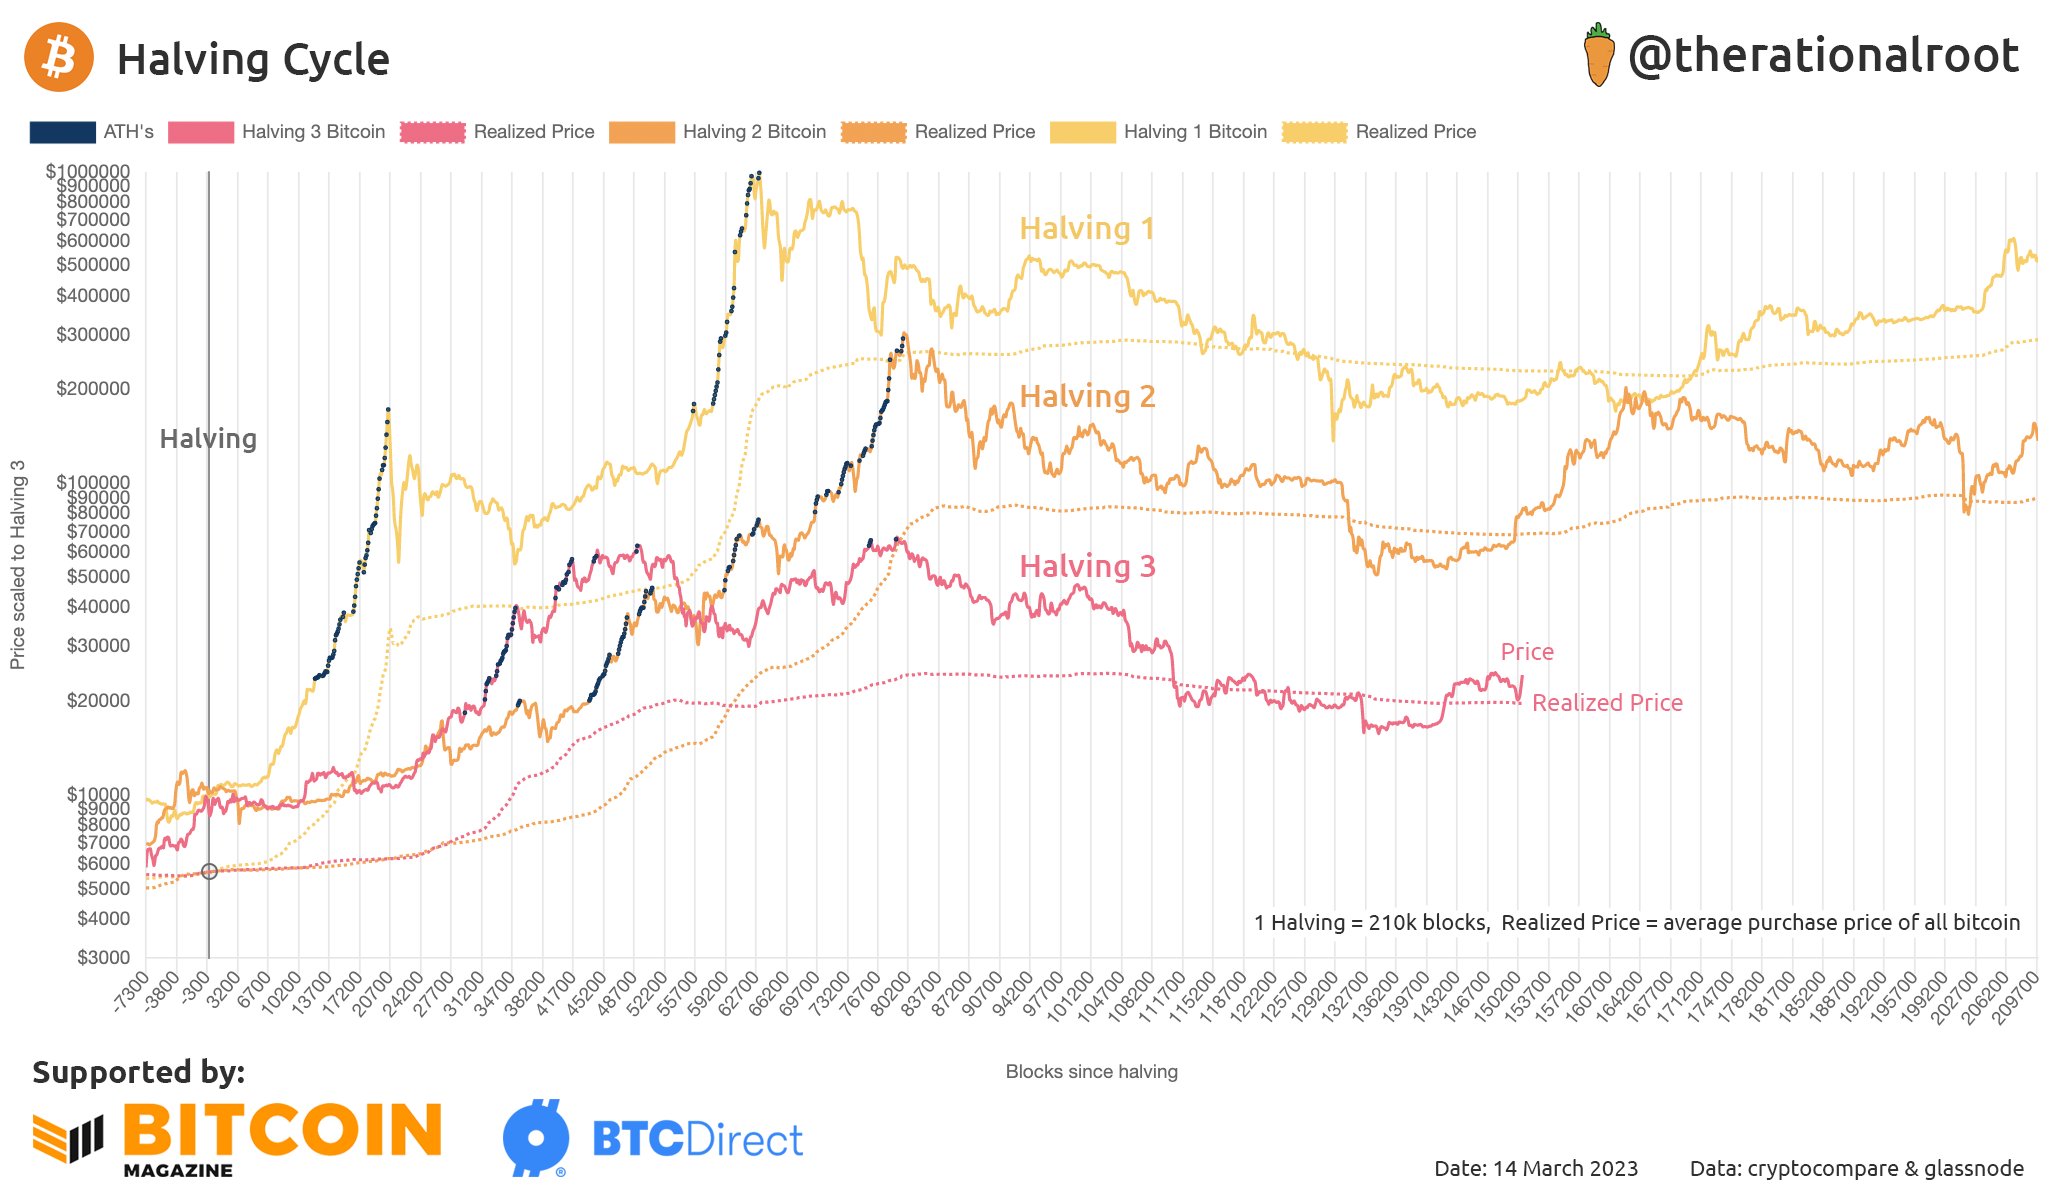
The previous two halving cycles compared with the current one so far | Source: therationalroot on Twitter
As you can see in the above graph, the different Bitcoin cycles so far have shown some similar features. Especially the previous and current ones share some bizarre similarities.
The tops of both these cycles appear to have formed after a similar number of blocks had been created in the cycles. The halving 1 cycle saw this happen earlier, but not by too much nonetheless. The bear market bottoms of all three cycles also had closely timed occurrences, with the halving 2 and 3 cycles again sharing a tighter timing.
Although the timing isn’t as striking as the bottoms, the latest cycle building up a rally out of the bear lows also looks similar to what happened in the second cycle, where the April 2019 rally took place.
Something that also seems to have held up throughout these cycles is the relationship between the price of Bitcoin and its realized price. The realized price is a metric derived from the realized cap, which is the capitalization model for the cryptocurrency that aims to provide a “fair value” for it.
In short, what the realized price signifies is the average acquisition price or cost basis in the market. This means that when the price dips under this level, the average holder enters into the loss territory.
During bull markets, this level has acted as support in all the cycles, while this behavior has flipped in bearish periods, where the level has provided resistance to the asset instead.
From the chart, it’s visible that Bitcoin retested this level very recently and successfully bounced off it, with the price of the asset gaining some sharp upwards momentum.
If the pattern held throughout the halving cycles is anything to go by, this could suggest that a bullish transition has now taken place in the market and a rally similar to the April 2019 rally might have begun.
BTC Price
At the time of writing, Bitcoin is trading around $24,600, up 11% in the last week.

BTC has surged in recent days | Source: BTCUSD on TradingView