

On-chain data shows Bitcoin selling on the crypto exchange Binance has started to weaken in recent weeks as outflows have shot up.
Binance Has Observed Negative Bitcoin Netflows Recently
As pointed out by an analyst in a CryptoQuant post, the world’s largest crypto exchange by trading volume, Binance, has seen a decline in BTC dumping recently.
The “netflow” is an indicator that tells us about the net amount of Bitcoin entering or exiting wallets of an exchange.
The value of this metric is calculated by simply taking the difference between the inflows and the outflows for the exchange in question.
When the netflow registers a positive value, it means inflows are currently dominating the outflows. Such a trend may be bearish for the price of Bitcoin as holders usually deposit their crypto to exchanges for selling purposes.
On the other hand, positive values of the indicator imply investors are taking out a net amount of coins at the moment. This kind of trend can be bullish for the crypto’s price as it may be a sign of accumulation.
Related Reading | Bitcoin Bearish Signal: Leverage Ratio Continues To Hit New Highs
Now, here is a chart that shows the trend in the BTC netflow for the crypto exchange Binance:


Looks like the netflow has been negative recently | Source: CryptoQuant
As you can see in the above graph, the Binance Bitcoin netflows had been positive during the selloff around the all-time high.
The exchange’s reserve had naturally been rising during this period as coins were being deposited into its wallets.
Related Reading | Bitcoin 2022 Recap, GA Day 1. Afternoon: Thiel, Salinas, Keiser, Mallers & More
All this while, the all exchanges reserve had actually been observing a decline, showing much of the selling was occurring only on a few exchanges like Binance.
In recent weeks, however, the Binance Bitcoin netflow has once again turned negative, leading to a slight decline in its reserve.
This would suggest that dumping is weakening on the crypto exchange. Last time such a trend formed was back in July 2021, following which a bull rally kicked off that took the price to its current ATH.
BTC Price
At the time of writing, Bitcoin’s price floats around $39.7k, down 11% in the last seven days. Over the past month, the crypto has gained 2% in value.
The below chart shows the trend in the price of the coin over the last five days.
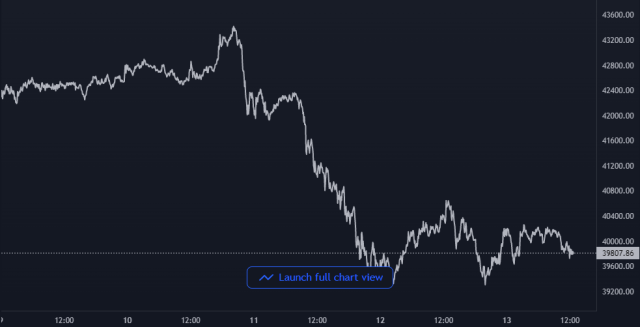

The price of BTC seems to have plunged down over the last few days | Source: BTCUSD on TradingView
Following the drop a few days back that has taken the value of the crypto below $40k again, Bitcoin has been moving sideways over the past couple of days.
Featured image from Unsplash.com, charts from TradingView.com, CryptoQuant.com