

Data shows that despite the recent downtrend in the price of Bitcoin, exchange netflows have largely remained negative.
Bitcoin Exchange Outflows Dominate Over Inflows
As per the latest weekly report from Glassnode, Bitcoin netflows have been mostly negative in the past couple of months, even though the price has been trending downwards in the period.
The “all exchanges netflow” is an on-chain indicator that measures the net amount of coins flowing into or out of exchanges, and the direction of this movement.
The metric’s value is calculated by taking the difference between the inflows and the outflows. If the netflow has positive values, it means the inflows are currently dominating the outflows as investors are depositing a net amount of coins to exchange wallets.
Investors usually send their coins to exchanges for withdrawing to fiat, or for purchasing altcoins. Therefore, such a trend, if sustained for some time, can be bearish for the coin’s price.
On the other hand, if the indicator has negative values, it implies that the outflows are overwhelming the inflows at the moment. Over a period of time, this trend can mean that holders are accumulating BTC as they are withdrawing a net amount of coins. Naturally, this can prove to be bullish for the crypto.
Related Reading | Early December Bloodbath Cranks Up Bitcoin Trading Volume
Now, here is a chart that shows the trend in the BTC netflows over the past year:


Looks like the indicator has been showing negative values recently | Source: The Glassnode Week Onchain (Week 50)
As the above graph shows, the BTC netflows have been largely negative recently. They turned positive before the 4th Dec crash, but have since again become negative.
Related Reading | MicroStrategy Increases Bitcoin Holdings With $82 Million Purchase
This is quite different from the May crash, where the indicator had highly positive values for a while as inflows dominated the outflows.
This shows that while the market sold during the 4th Dec crash, the demand for Bitcoin has still been quite strong as the highly negative netflows would suggest.
BTC Price
At the time of writing, Bitcoin’s price floats around $47.7k, down 7% in the last seven days. Over the past thirty days, the crypto has lost 26% in value.
The below chart shows the trend in the price of the coin over the last five days.
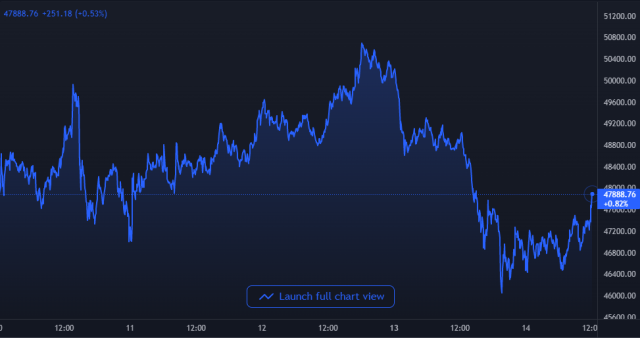

BTC's price seems to have once again plunged down | Source: BTCUSD on TradingView
Over the last few days, Bitcoin has mostly consolidated in the $45k to $50k range. At the moment, it’s unclear when the coin might break out of this sideways movement, or which direction it might escape in. However, if the netflows are anything to go by, the coin’s price may be bullish in the long term.
Featured image from Unsplash.com, charts from TradingView.com, Glassnode.com