

On-chain data shows the demand on the Ethereum network has continued to drop recently, a sign that could be bearish for the asset’s value.
Ethereum Total Transaction Count Continues To Go Down
As pointed out by an analyst in a CryptoQuant post, the ETH transaction count has observed a significant plunge recently. The “transaction count (total)” is an indicator that measures the total number of transfers taking place on the Ethereum blockchain on any given day.
When the value of this metric is high, it means traders are active on the network right now. On the other hand, low values imply the chain is seeing low activity at the moment. Now, here is a chart that shows the trend in the 30-day Exponential Moving Average (EMA) version of this indicator over the last couple of years:


The 30-day EMA value of the metric seems to have been constantly going down in recent months | Source: CryptoQuant
As shown in the above graph, the 30-day EMA Ethereum transaction count has been in a state of overall decline since May 2021, when ETH set its then all-time high. The indicator has, however, seen some periods of respite where the trend would temporarily reverse, and the metric would climb up before continuing back on the downward trajectory.
These bursts of activity coincided with local tops in the price of the crypto, a trend that makes sense as rallies usually require a large number of traders to be sustainable. Though, just like uptrends in the metric accompanied bullish momentum in the price of Ethereum, downtrends usually resulted in the crypto’s value also observing a bearish fate.
Most recently, the 30-day EMA transaction count has once again seen a plummet, showing that the demand for the crypto is still absent from the market. And if recent patterns are anything to go by, this decline may lead to Ethereum plunging down soon as well.
ETH Price
At the time of writing, Ethereum’s price floats around $1,200, up 1% in the last week. Over the past month, the crypto has gained 1% in value.
Below is a chart that shows the trend in the price of the coin over the last five days.
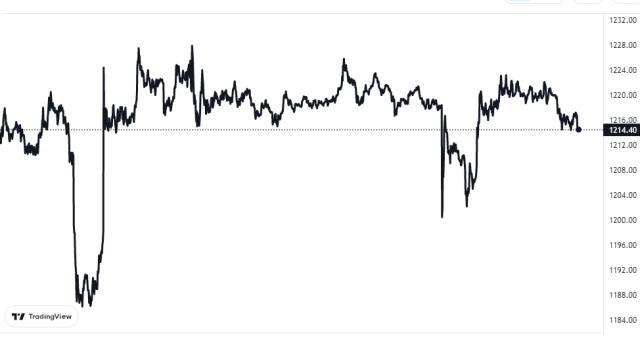

Looks like ETH has been at a standstill in the last few days | Source: ETHUSD on TradingView
Ethereum has been locked in sideways movement for a while now, but it’s unclear when the crypto may escape from this consolidation. If the transaction count metric is anything to consider, then the break might be coming soon and in a direction that ETH investors wouldn’t like.