

Ethereum could undergo a stronger drop in the days ahead, analysts say, as the cryptocurrency slides below key support levels.
Ethereum Loses Key Support Level on a Short-Term Basis: Analysis
A crypto-asset analyst shared the chart below just recently, showing how the coin has moved below a rising wedge pattern. It is still in a decent spot on a weekly time frame though may face an intra-day pullback, the chart suggests.
“$ETH $ETHUSD #Ethereum – 1W Confirmed breakdown from the Rising Wedge But as long as ETH remains above $433 by Weekly Close… ETH would still be technically well-positioned on the Weekly timeframe It would just be a matter of getting that follow-through post-retest of $433.”

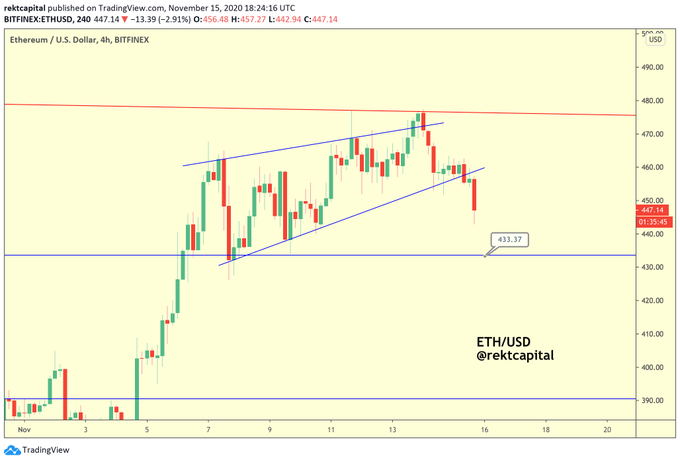
Chart of ETH's price action over the past few days with analysis by crypto trader Rekt capital (@RektCapital on Twitter)
Source: ETHUSD from TradingView.com
Also of concern, there appears to be a large amount of Ethereum selling pressure on leading exchanges as the price attempts to inch higher.
A number of analysts have shared charts over the recent days showing large sell walls that are limiting Ethereum’s upside. A sell wall is a large block of sell orders that are situated around a single price level, preventing an asset from moving higher unless there is a considerable amount of buying volume in that market.
There are also charts showing that there is a large amount of sell-side liquidity or short-taking propensity in Huobi’s Ethereum December futures market. On the matter, a trader said:
“kinda agree, Im hedging some of my DeFi exposure iva ETH, huobi whales have thick asks on quarterlies too so upside on ETH should be limited.”
Not All Hope Is Lost
The long-term trend still seems to favor bulls despite any weakness that may transpire over the near term.
One trader shared the chart below just recently. It shows Bitcoin’s price action relative to Ethereum’s price action over the past few years.
While the charts are mostly correlated, ETH and BTC have begun diverging over recent months as Bitcoin has taken the attention of most investors in the space. BTC is outpacing altcoins amid this move higher due to the strength of the move.
According to this fractal analysis, there is a good chance that Ethereum will surge dozens of percent in the weeks ahead so that it will catch up with bitcoin

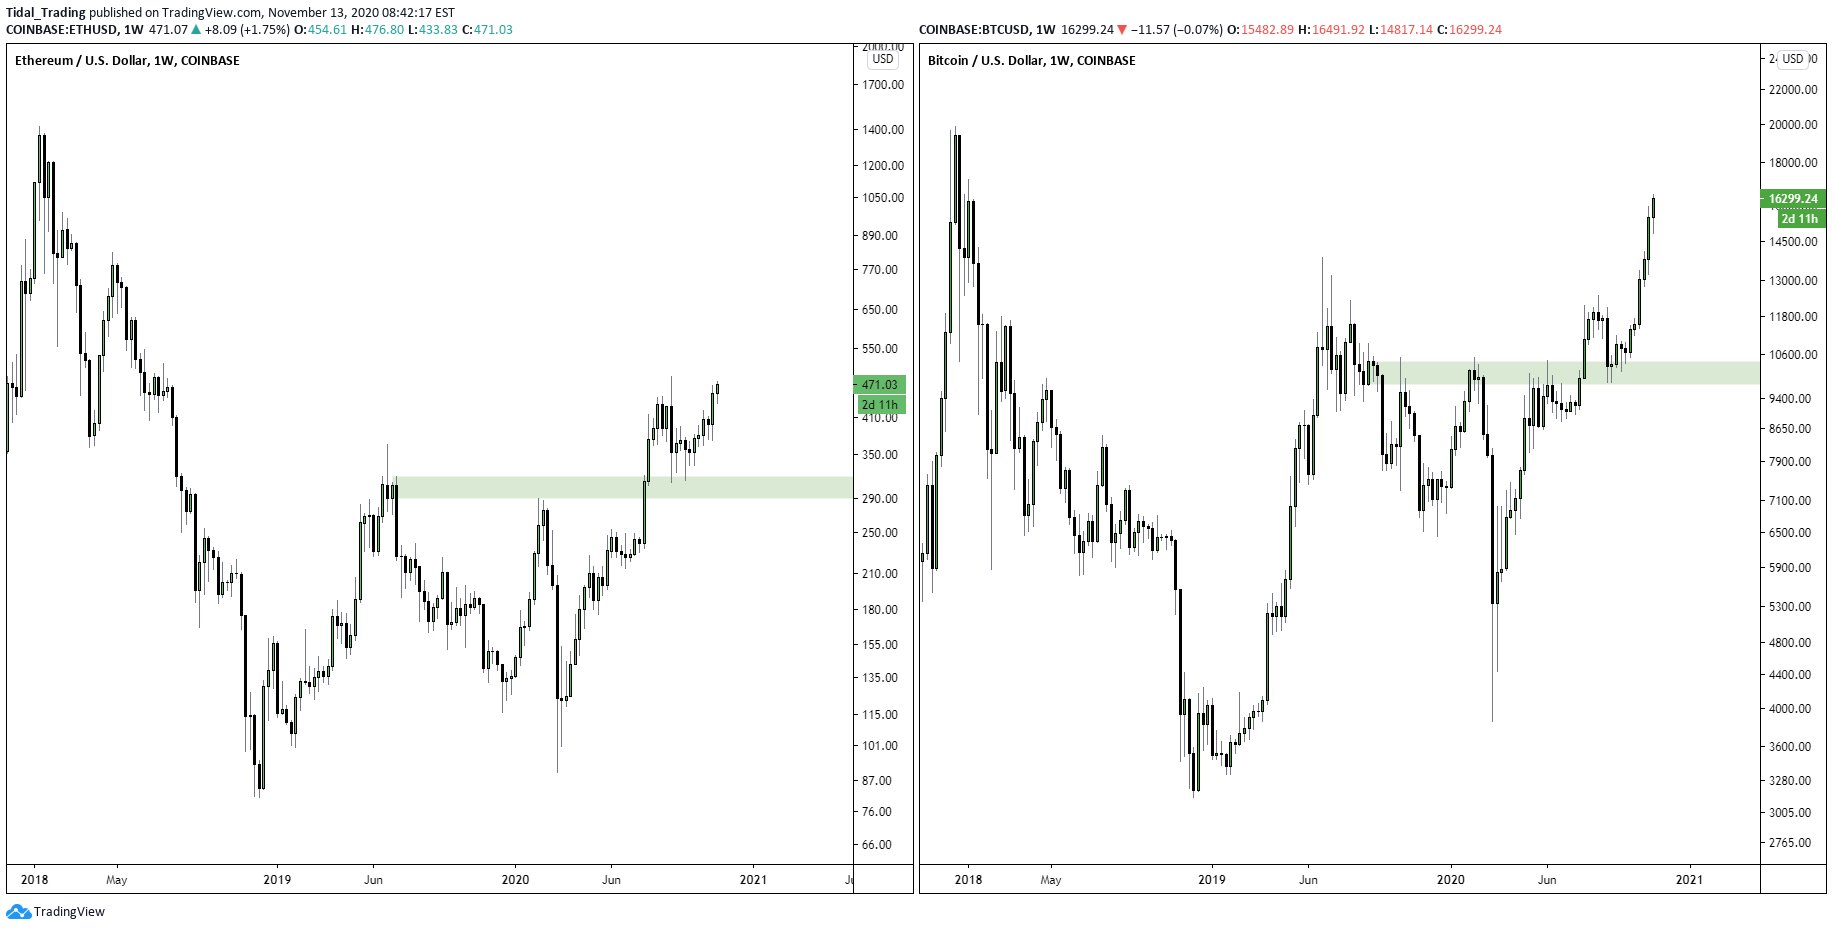
Chart of BTC's price action over the past few years with a fractal analysis to ETH's chart over the same time frame by crypto trader HornHairs.
Source: BTCUSD from TradingView.com
Featured Image from Shutterstock
Price tags: ethusd, ethbtc
Charts from TradingView.com
Ethereum Drops Below Crucial Technical Pattern and Must Hold $430