

Bitcoin price is back retesting its current all-time high above $58,000, but hasn’t been able to crack it just yet after a few attempts. However, a fractal found matching the 2019 rally has been discovered in the recent price action that simply cannot be unseen.
Here’s a closer look at the fractal itself, and what it could suggest if the same path is followed as the last time it ominously appeared.
Bitcoin Fever Spreads, But Struggle To Set New High Could Be Bearish
Bitcoin FOMO is in full effect like never before, attracting not only retail investors, but traders, corporations, hedge funds, and institutional investors. The impact these new participants have had on price appreciation thus far has been nothing short of incredible.
From a low of under $4,000 nearly one year ago today, the leading cryptocurrency by market cap has risen to a current high of more than $58,000 per coin. The price per BTC reaching such heights propelled the cryptocurrency’s total market capitalization to over $1 trillion.
RELATED READING | HOW LASER EYES COULD HAVE BITCOIN INVESTORS SEEING RED
But at those highs, the cryptocurrency met its first serious resistance, and has been struggling to get back above since. The most recent attempt was swatted down preemptively by bears, coinciding with the non-news that Oracle didn’t buy the BTC the community was expecting it to.
However, that might not be the reason for bears making a stand over the last 24 hours.
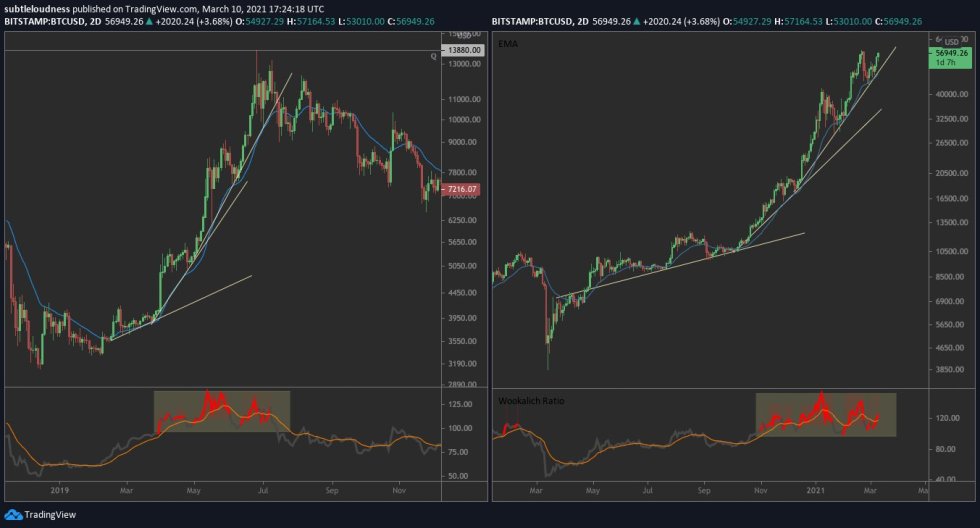

An eerily similar looking fractal has appeared on Bitcoin price charts | Source: BTCUSD on TradingView.com
Cannot Unsee: Familiar Fractal Could Yield Familiar Results
When Bitcoin left its bottom trading range at under $4,000 for the first time, the cryptocurrency almost immediately rocketed to $14,000. The uptrend ran out of steam, and eventually corrected back down to confirm the range as support on Black Thursday last year.
The current uptrend’s momentum is waning, albeit only slightly, but a fractal from the 2019 rally could indicate that Bitcoin is about to topple once more.
RELATED READING | ONE YEAR LATER: BITCOIN EMERGES AS “THE STIMULUS ASSET”
Both rallies started out with a more reasonable uptrend line, that eventually goes increasingly vertical. At the height of the parabola, there’s a large rejection, a failed retest, and a breakdown. This time around, Bitcoin hit $58,000 and was immediately sent crashing back down to under $50,000.
The retest has since failed, but is in the process of making another attempt. Failure here could validate the fractal and cause the cryptocurrency to drop lower to retest support levels below.
Coinciding with the comparable price action and trendlines, is a similar reading on the crypto analyst who spotted the fractal’s trading indicator. Could this be the end of the current rally for the time being?
Featured image from Deposit Photos, Charts from TradingView.com