

While fundamental analysts predict a continued rally to $1000 and beyond for the foreseeable future, technical indicators paint a more detailed picture. According to the charts, the ride up to $1000 will be bumpy, with periods of profit taking and resistance, especially around the $800 range.
Also read: Blockchain as the Matrix: Are We Entering a Virtual Life?
Technical Analysis: Bumps in the Road
Long-Term Analysis
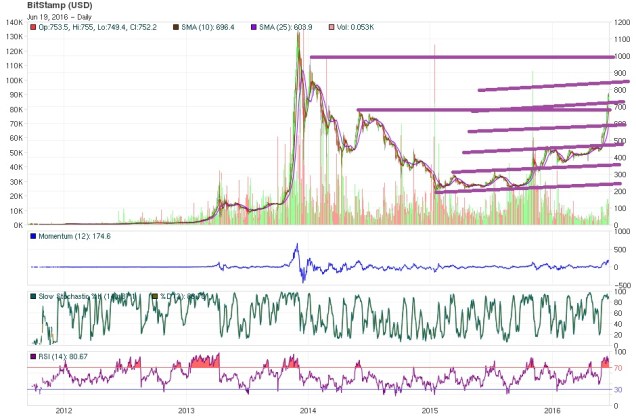

Almost at the $820 technical objective level, a distribution zone could take place with a trading box among this resistance and $600.
Indicators reflect fiction prices at this level, with irregular trading volume because of the distribution activity depending on the fresh demand of new holders. However, the less volatility there is in a resistance level allows the contrary opinion theory, and main players should be placing their profit taking with a re-buying strategy at $600.
Major figures have been accomplished, and Fibonacci is getting fulfilled, as well as the Gann Angles Theory, rounded bottom pattern and every mathematical forecast.
Only news and fundamentals support the present climbing, and any of those components have the capability to smash the present scenario for a technical correction that ends the cycle to start another from the $600 level, with a sideways trading box zig-zagging to $820, leading into a rise to 1800 at the end of 2016.
Mid-Term Analysis
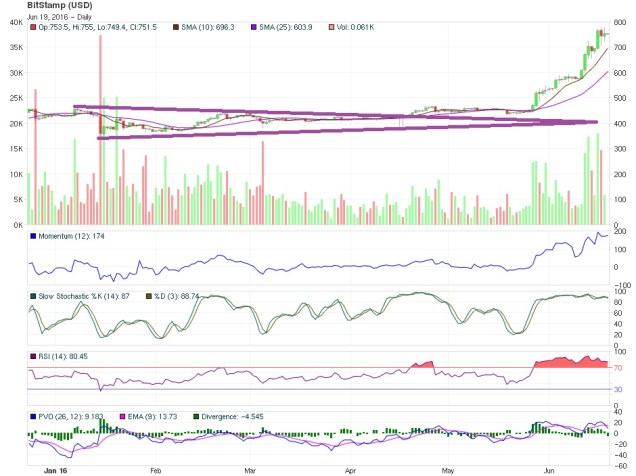

Now, prices are rising, reaching the distribution zone at $820 / $790, where a heavy short marketplace is expected.
According to indicators, the up-trend line is strong enough to accomplish this technical objective and to end this mid-term cycle with a short correction to $600, placing the quotes into a trading box among $820 and $600 in a three-month sideways lateral market that zig-zags the chart, ending the present scenario and starting a fresh one from the box to new technical objectives around $1800 at the end of 2016.
Only political data, fundamentals and hot news are sustaining the present rise, adding the wishful thinking of current players whom are anticipating a continued rally to the $1000 level.
Technical analysis points to a different situation introducing the possibility of a short distribution zone around $820 and re-buying area at $600 in a zig-zag movement for the next time period.
Short-Term Analysis
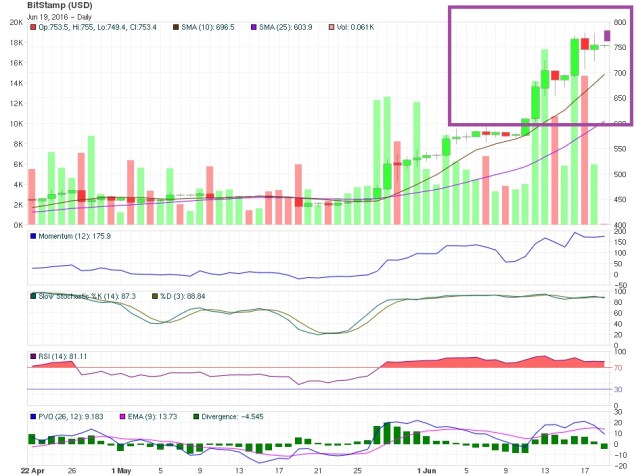
The only support remains at $600, while prices head towards resistance at $820, getting into a trading box with these top and bottom levels.
There are not any minima to take in account as with the mid-term analysis, but volume isn’t thick enough to ensure any of the picks as a technical goal.
If a correction movement takes place, it would be the end of a large cycle from the $1200 high in December 2013, and the start of after a zig-zag sideways lateral box lasting three months with 200 basis points in a trading active range, which can be considered by the direct observation of the volume activity.
As with every trading range, contingent orders will be placed in a pyramid model that recognizes the oscillator signals of slow stochastics and RSI from below $630 and over $790, in an attempt to harvest profits that lowers the main position cost in the forecasting of the new cycle rise to $1800 for the end of 2016.
Bitcoinist is not responsible for any gains or losses incurred while trading bitcoin. Trade at your own risk.